


Portugal 2–1 Croatia: how the Jarvis supercomputer's prediction held up
Nhipbong Analytics
Jarvis prediction desk

Portugal closed out their FIFA World Cup meeting with Croatia with a 2–1 win, a result worth holding up against the Jarvis supercomputer model's pre-match forecast. From the 55%–27%–18% split in probabilities to the predicted scoreline of 2–0 and an expected goal total of 2.5952, this is a chance to see just how closely a probability-based forecast tracked this match, and where it drifted.
- Portugal beat Croatia 2–1, with three goals scored in the match overall.
- Before kick-off, Jarvis rated Portugal at 55% to win, a draw at 27%, and Croatia at 18% to win.
- The model's predicted scoreline was 2–0 (not its single predicted score); the actual result missed that by one goal, finishing 2–1.
- An expected goal total of 2.5952 and a 48% chance of three or more goals correctly captured the high-scoring trend that played out.
- Forecast confidence was rated LOW, consistent with the scoreline gap that was recorded.
| Outcome | Portugal | Draw | Croatia |
|---|---|---|---|
| Jarvis probability | 55% | 27% | 18% |
| Metric | Jarvis forecast |
|---|---|
| Expected total goals | 2.6 |
| Predicted score | 2-0 |
| Chance of 3+ goals | 48.0% |
Head to head: Jarvis prediction vs the actual result
| Category | Prediction (pre-match) | Actual | Correct? |
|---|---|---|---|
| Winner | Portugal (55%) | Portugal (2–1) | ✓ Right |
| Predicted score | 2–0 | 2–1 | ✗ Off |
| Expected total goals | 2.6 goals | 3 goals | ≈ Close |
| Chance of 3+ goals | 48.0% | Yes | ✗ Off |
How the Match Unfolded
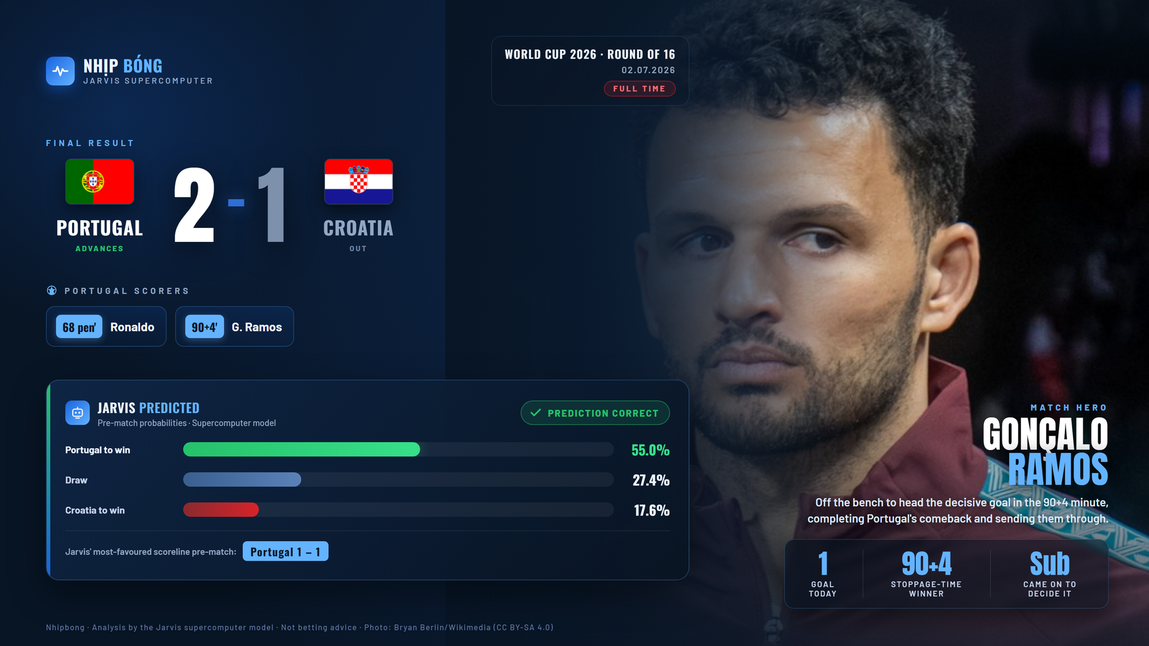
The match between Portugal and Croatia ended in a 2–1 win for Portugal. Three goals were scored in total, no small number set against the backdrop of the pre-match forecast. The route there was less smooth than the scoreline suggests: Croatia actually went ahead through Ivan Perišić on 53 minutes. Cristiano Ronaldo levelled from the penalty spot on 68, and it took until the fourth minute of stoppage time for Gonçalo Ramos to score the winner. So Portugal won by a single goal over Croatia, exactly the direction the Jarvis supercomputer model had leaned toward before kick-off.
Match Highlights

The first point worth noting is the final result itself: Portugal, the side seen as stronger going in, held onto the win. Second, the match produced three goals, a number that points to an open, back-and-forth contest rather than a stalemate. Third, Croatia weren't shut out: the losing side still got one on the scoreboard and kept the final gap to a single goal. Put those three details together and you get a familiar picture for matches with a clear but not overwhelming favourite - the stronger side wins, while the other still manages to leave its mark on the scoreline.
Jarvis Checked Against the Result: Pre-Match Forecast vs. What Actually Happened


This is the heart of the piece: setting what Jarvis produced before the match next to what actually happened. On the winner, the model rated Portugal the clear favourite at 55%, against 27% for a draw and 18% for a Croatia win. The final result, a 2–1 win for Portugal, landed squarely in the scenario Jarvis rated most likely of the three before kick-off.
On the scoreline, the model put forward a predicted score of 2–0. It's worth being precise here: this was never meant as the single most likely scoreline, but a number Jarvis uses to sum up the match's overall lean. The actual result of 2–1 missed that predicted score by exactly one goal. That gap lines up with a detail already built into the pre-match data: the forecast's confidence level was rated LOW. When confidence is tagged low, the possible gap between the predicted score and the real result widens, and a one-goal difference sits well within that range - meaning the model had already allowed for this margin, rather than simply getting it wrong.
On total goals, Jarvis projected an expected 2.5952, alongside a 48% chance of the match producing three goals or more. The three goals actually scored sit right at the edge of that expected range, if anything slightly above it. Taken together across all three layers of data - the winner, the goal-scoring trend, and the predicted scoreline - the model got the first two right and missed by just one goal on the specific score.
What the Expected-Goals Number Actually Tells You
The number in Jarvis's output most likely to be misread is the expected goal total of 2.5952. This isn't a claim that the match would produce roughly two and a half goals, since no match can have half a goal. It's an average pulled from many different scoreline scenarios the model weighs, each carrying its own probability weight. Some scenarios are low-scoring, some are high-scoring, and 2.5952 is the balance point across all of them.
Alongside it sits a more concrete figure: a 48% chance of the match reaching three goals or more, meaning nearly half of the scenarios the model built land in the high-scoring bracket. The actual match produced exactly three goals, sitting right in that upper group. That's the right way to read an expected-goals figure: it doesn't point to one single scoreline, it describes an overall trend - this match leaned toward being open rather than a stalemate, and the three goals scored followed exactly that direction. When you want to know whether a model is leaning toward a low-scoring or high-scoring match, the expected total together with the percentage at the three-goal threshold tells you far more than any single predicted scoreline can.
What the Probability Numbers Really Mean
One thing worth repeating every time you read numbers like these: the 55% given to Portugal was never a guarantee of victory, it's a relative level of confidence, set alongside 27% for a draw and 18% for a Croatia win. All three scenarios carry a nonzero probability, meaning all three were genuinely possible in reality, differing only in how likely the model considered each one.
Even a figure like 18% carries real weight rather than being something to wave off: statistically, that's a scenario expected to show up roughly once in every five to six repeats of a similar situation. In this match, that scenario didn't come to pass since Portugal still won, but the 18% is a reminder that the side rated as the underdog could well have produced a different outcome. That's also how a probability forecast should be read: it tells you the lean and how strong that lean is, not a single outcome locked in stone.
Data Source

Every forecast figure in this piece comes from the Jarvis supercomputer model and was produced before the match was played: the 55% probability of a Portugal win, 27% for a draw, 18% for a Croatia win, the predicted scoreline of 2–0, the expected goal total of 2.5952, the 48% chance of three or more goals and the LOW confidence rating. The scorers and goal times (Perišić 53', Ronaldo 68' pen, Gonçalo Ramos 90+4') come from the match record. This is statistical analysis, not betting advice.
Frequently asked questions
How did Jarvis forecast the Portugal vs Croatia match before kick-off?
Before the match, the Jarvis supercomputer model gave Portugal a 55% probability of winning, a draw 27%, and Croatia 18%, alongside a predicted scoreline of 2–0 and an expected goal total of 2.5952.
Was the predicted scoreline of 2–0 Jarvis's exact scoreline prediction?
No. It's the figure the model uses to illustrate the match's overall lean, not the scoreline it considered most likely. The actual final result was 2–1 to Portugal, one goal off that predicted score.
Did the actual result match the pre-match forecast?
Portugal won, exactly as the side rated the stronger favourite (55%), and the three goals scored sat right at the expected total of 2.5952, matching the high-scoring trend Jarvis quantified as a 48% chance of three or more goals. Only the specific scoreline missed by one goal against the predicted 2–0.
Why was this forecast's confidence level rated LOW?
Jarvis grades its confidence on two things: how deep its input data is, and how tightly those inputs agree with one another. For this match the input data was deep, but the signals pulled clearly in different directions and the model could not fit them into one tight picture, so the rating stayed at LOW. In practice, low confidence means the possible gap between the predicted scoreline and the actual result can run wider, which is exactly what played out here.
Who scored in this match?
Ivan Perišić put Croatia ahead on 53 minutes. Cristiano Ronaldo equalised for Portugal from the penalty spot on 68, and Gonçalo Ramos scored the winner in the fourth minute of stoppage time (90+4).