















United States 1–4 Belgium: how the Jarvis supercomputer's prediction held up
Nhipbong Analytics
Jarvis prediction desk

United States 1–4 Belgium. That was the final score of a match where, before kick-off, the Jarvis supercomputer model split its probabilities almost evenly across the three outcomes, without a clear lean either way. The result landed a long way from that balanced picture, so here I go back through the numbers to see which parts of the forecast held up and which ones the game left behind.
- Final score: United States 1–4 Belgium, a three-goal win for Belgium at the FIFA World Cup.
- In the numbers Jarvis locked about seven hours before kick-off, the United States had 38%, the draw 30% and Belgium 32%, an almost even contest.
- The five goals scored went well beyond the 2.78 goals the model expected before the match.
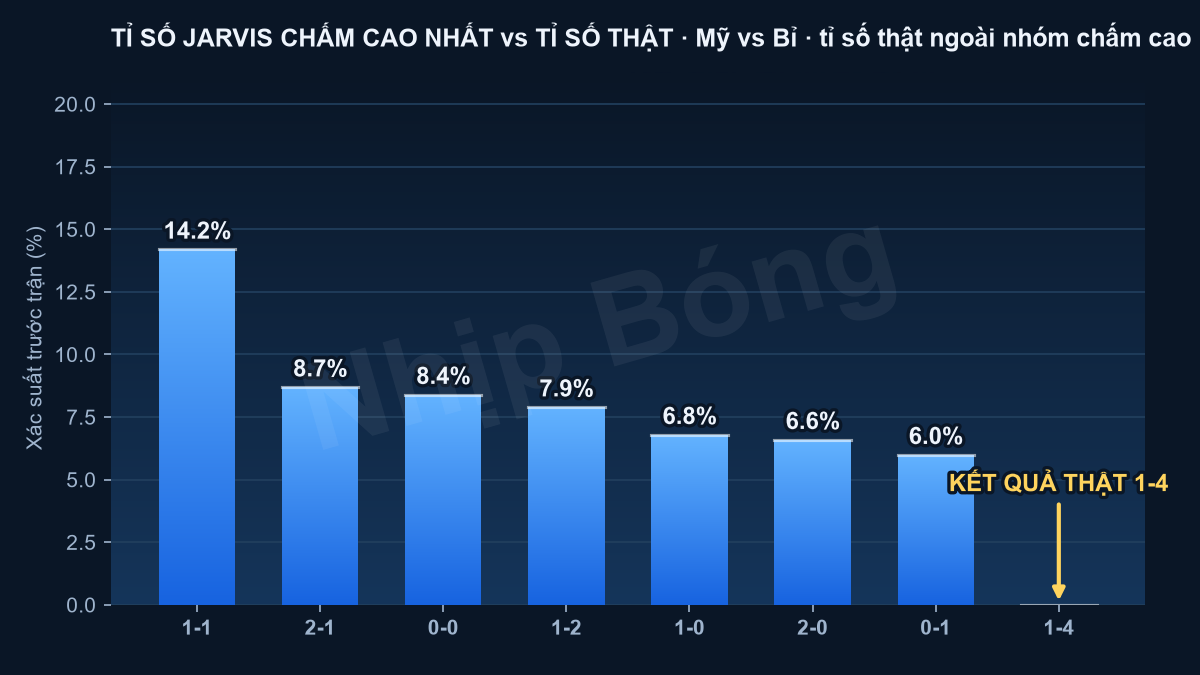
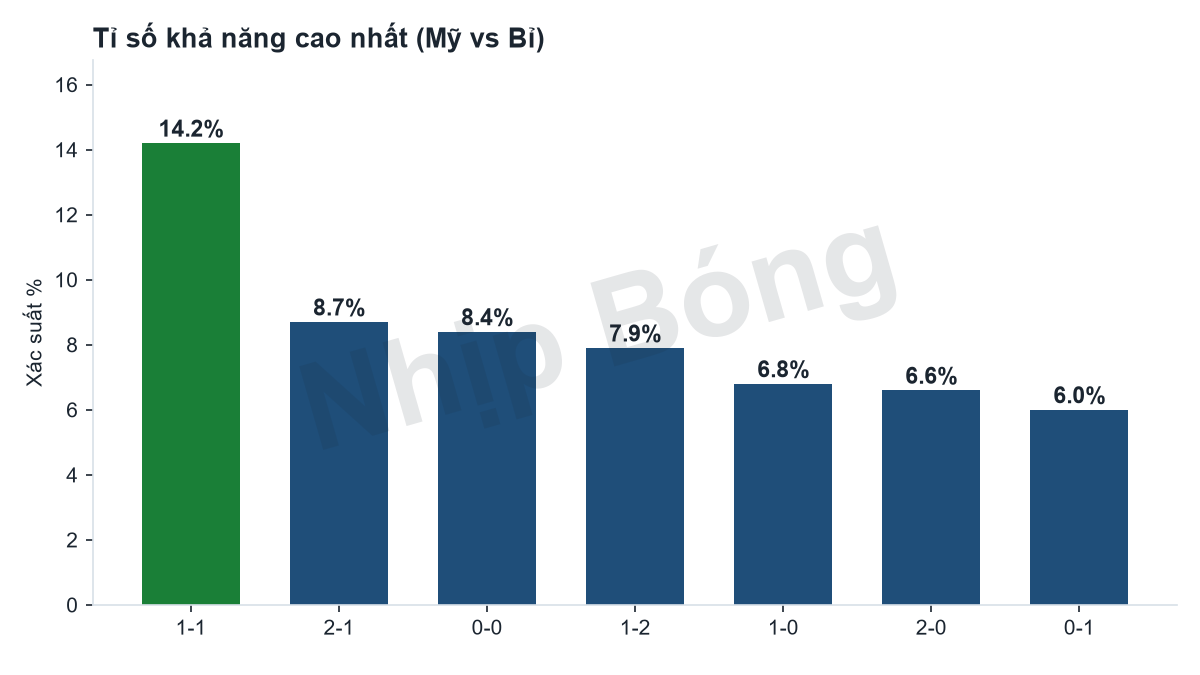
- Jarvis's single most likely score was 1–1 (14.2%) and its representative score for a United States win was 2–1 (8.7%); the actual 1–4 sat outside the scores the model rated highest, and the forecast carried a low confidence rating from the start.
- Charles De Ketelaere scored twice for Belgium, and Hans Vanaken and Romelu Lukaku added one each; the United States' only goal came from a Malik Tillman free kick.
| Outcome | United States | Draw | Belgium |
|---|---|---|---|
| Jarvis probability | 38% | 30% | 32% |
| Metric | Jarvis forecast |
|---|---|
| Expected total goals | 2.78 |
| Likely score | 1–1 |
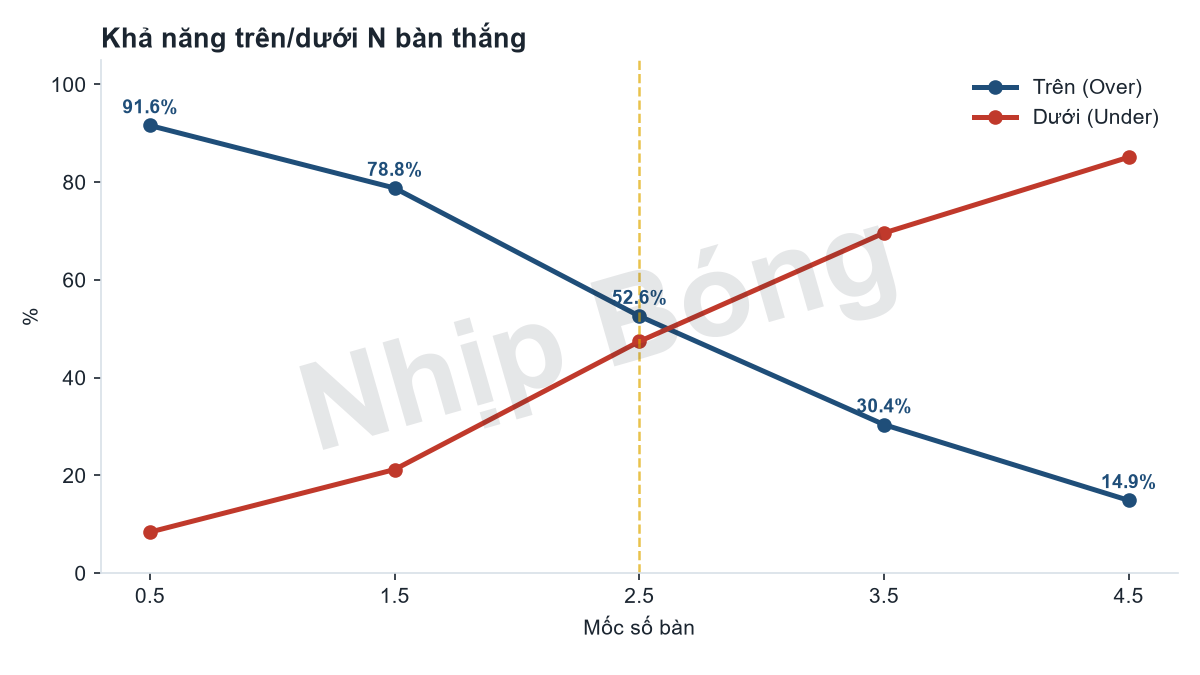
| Chance of 3+ goals | 52.6% |
| Confidence | Low |
Head to head: Jarvis prediction vs the actual result
| Category | Prediction (pre-match) | Actual | Correct? |
|---|---|---|---|
| Winner | USA (38%) | Belgium (1–4) | ✗ Off |
| Most likely score | 1–1 (14.2%) | 1–4 | ✗ Off |
| Representative score (United States win) | 2–1 (8.7%) | 1–4 | ✗ Off |
| Expected total goals | 2.78 goals | 5 goals | ✗ Off |
| Chance of 3+ goals | 52.6% | Yes | ✓ Right |
How the match unfolded
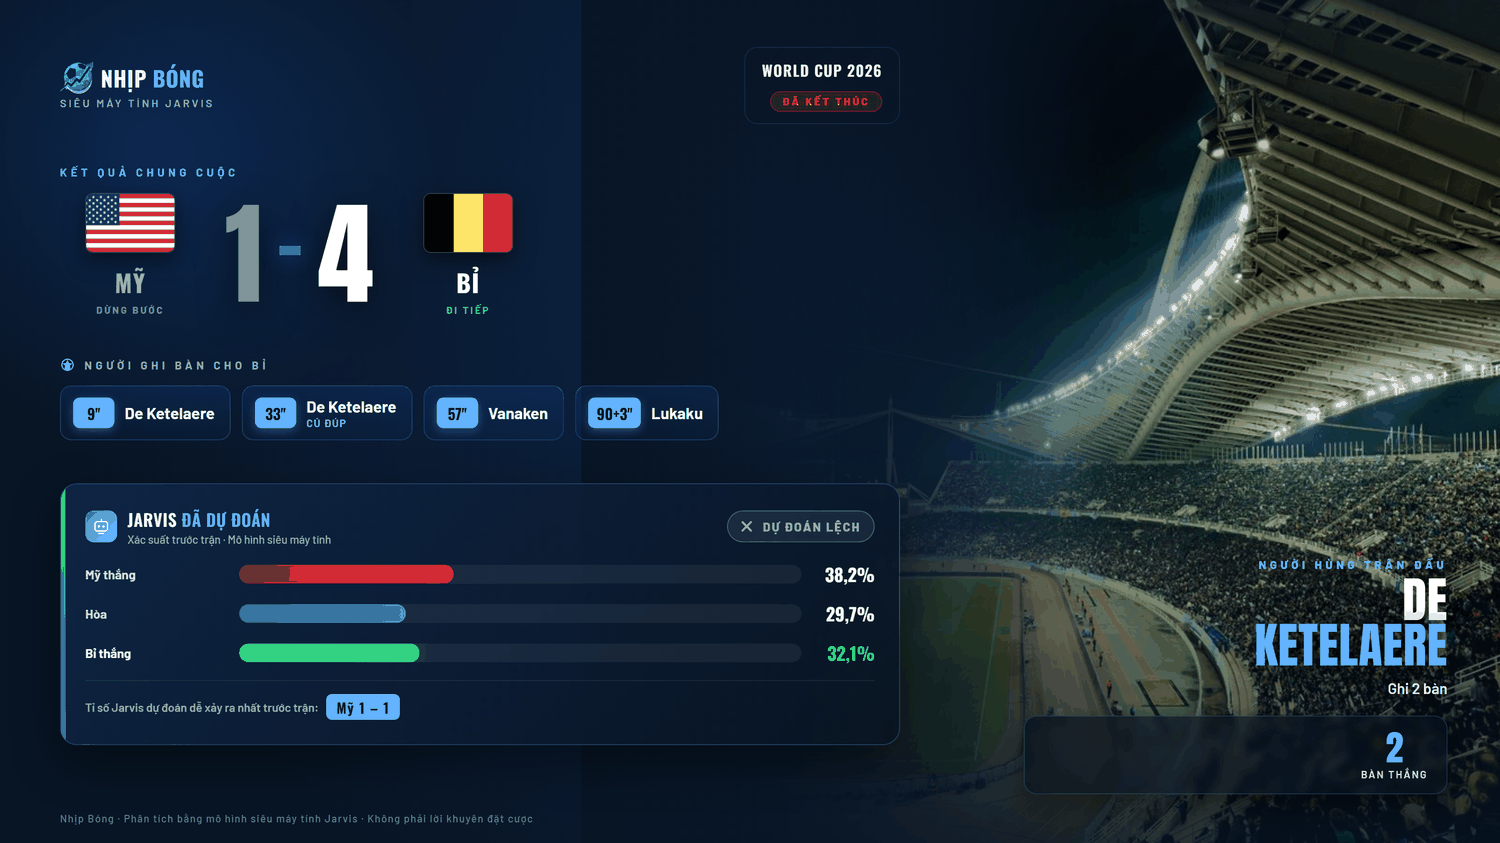
The FIFA World Cup meeting between the United States and Belgium ended 1–4, firmly in favour of the visitors. It was a wide margin, with five goals in a single match: one for the United States and four for Belgium, a three-goal gap by the final whistle.
Belgium went ahead in the 9th minute through Charles De Ketelaere, set up by Nicolas Raskin. Malik Tillman levelled for the United States with a direct free kick in the 31st minute, but only two minutes later De Ketelaere headed Belgium back in front at 2–1, assisted by Leandro Trossard. After the break Hans Vanaken made it 3–1 in the 57th minute from a De Ketelaere assist, and Romelu Lukaku wrapped it up in the third minute of stoppage time (90+3) from a Vanaken pass. The United States picked up two yellow cards, for Weston McKennie (35th minute) and Malik Tillman (69th minute). Belgium's attack had an outstandingly efficient day, while the United States defence conceded far more than a balanced match would normally see.
The talking point
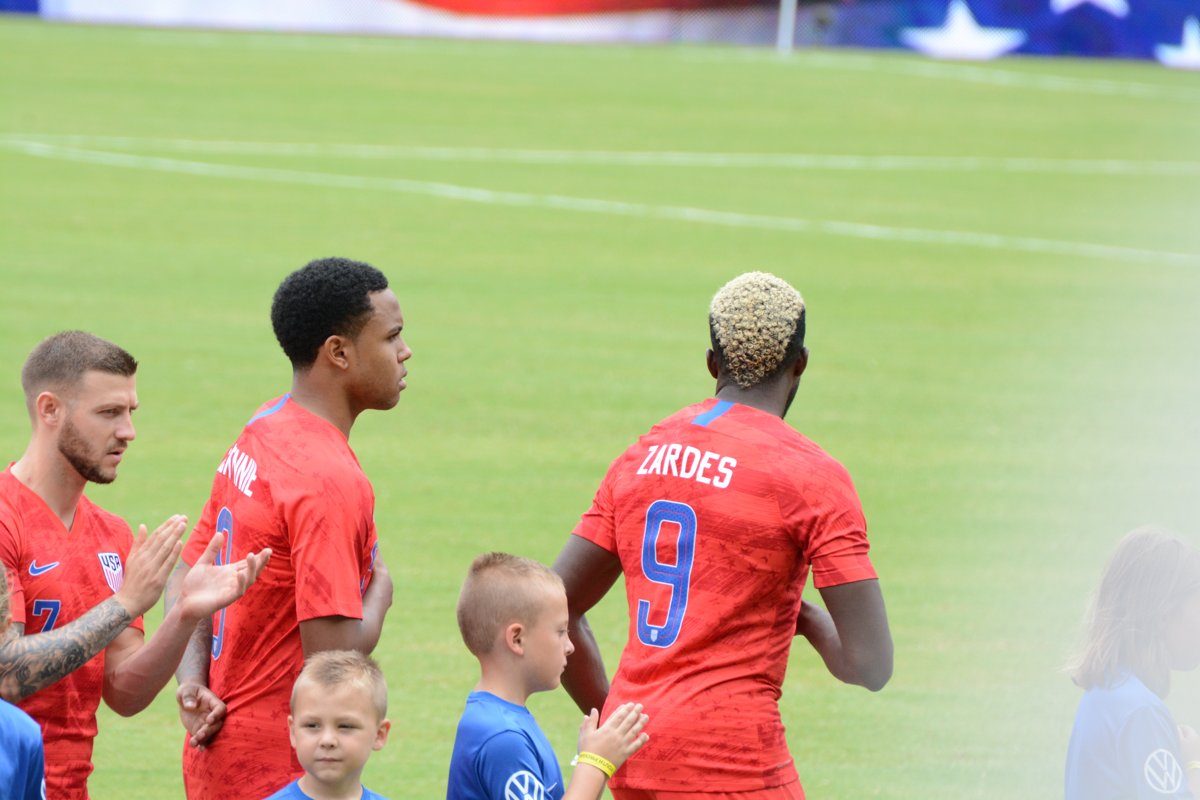
The real talking point of this match is not how many goals went in, but that the side the model rated less likely to win was the one that won big. Before kick-off Jarvis gave Belgium a 32% chance of winning, below the United States' 38% and only about two percentage points above the 30% draw. Yet when the game was over, it was Belgium who dominated the scoreboard.
For me, that is the shock worth talking about, more than the goal count itself. A model that puts three outcomes almost level usually implies a tight, hard-to-call game; what happened on the pitch was clearly one-way, in favour of the side given the lower chance of winning. The gap between how Jarvis saw this match and how it actually played out is the central story this piece takes apart.
Jarvis compared: pre-match forecast versus reality
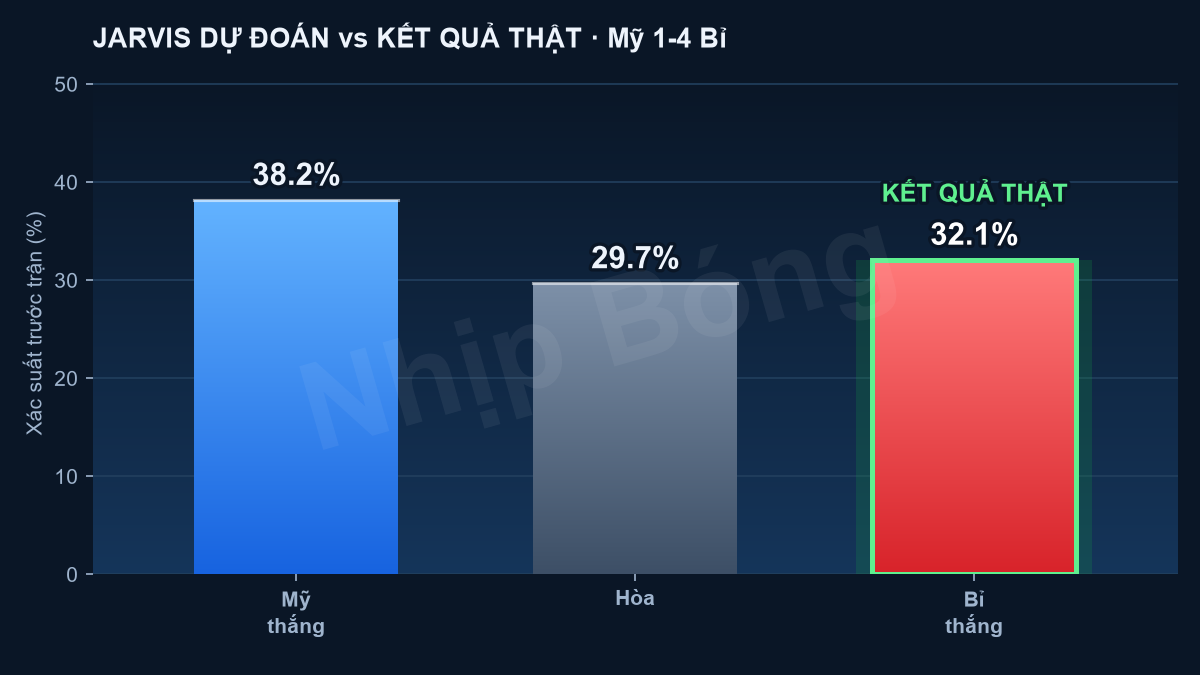
In the numbers locked at 17:00 UTC on 6 July, about seven hours before kick-off, the Jarvis supercomputer model gave the United States a 38% chance of winning, the draw 30% and Belgium 32%. That is an extremely tight read, with the three outcomes separated by only about eight percentage points. Neither side held a commanding edge in this probability picture.
On the scoreline, two figures need to be kept apart. The single most likely score in Jarvis's table was 1–1, at about 14.2%. The representative score was 2–1: among the scorelines in which the United States win, the outcome the model leaned towards, it was the most probable, at about 8.7%. The expected total came out at 2.78 goals, and the chance of three or more goals was put at 53%, just over half but far from overwhelming. Jarvis itself also rated its confidence in this forecast as low before kick-off, a sign that the uncertainty around these numbers was higher than usual.
Against what actually happened, Belgium won 4–1, a three-goal margin with five goals in all. That is well beyond the 2.78 goals expected, and the 1–4 scoreline was a long way from both the most likely 1–1 and the representative 2–1; it was not even among the seven scores Jarvis rated highest. In other words, on almost every measurable count the match was heavier and more one-sided than the model sketched, and the low confidence rating had already signalled that a miss of this size was entirely possible.
Tactics through the lens of probability
On the tactical side, I read this match through the clearest signal Jarvis left before kick-off: the expected scoring tempo. The 53% chance of three or more goals, combined with an expected total of 2.78, already pointed to an open game in which both sides could score, rather than a tight defensive battle.
The five goals that actually went in confirmed the "open game" direction the model had hinted at; the difference is that the goals piled up heavily on one side instead of being shared out. Put another way, the model read correctly that the match would have goals, but not which way they would fall.
That is also why, when I read a pre-match forecast, I remind myself not to stop at the question of who wins but to look at the scoring-tempo signal too. In this match, the tempo signal, a 53% chance of three or more goals, turned out to be much closer to reality than the signal about the winner.
What the probabilities really mean
A 38% chance for the United States before kick-off did not mean the United States would naturally win, just as Belgium's 32% did not make a Belgium win so unlikely as to be far-fetched. Statistically, 32% is close to one time in three, not a rare scenario at all.
By rating its confidence in this forecast as low, Jarvis was warning that the spread around the 38%–30%–32% split was wider than usual, and that the match could easily go in directions other than the central scenario. In the end, a set of probabilities only describes how likely each scenario is, not a promise about the final result, and an outcome outside the scenario the model saw as most likely still sits inside the uncertainty the low confidence rating had flagged.
Reading a probability forecast properly, in my view, means taking in the whole picture: all three percentages, the most likely score and the representative score, the expected total and the confidence rating that comes with them, rather than fixating on the highest percentage and assuming it is bound to happen.
Data sources and notes
All the forecast figures in this article, including the 38%–30%–32% win probabilities, the most likely score of 1–1 (14.2%), the representative score of 2–1 (8.7%), the expected total of 2.78 goals, the 53% chance of three or more goals and the low confidence rating, come from the Jarvis supercomputer model's numbers locked at 17:00 UTC on 6 July, about seven hours before kick-off. The preview published on 5 July used an earlier set of numbers, in which Belgium were slightly ahead on 36%, with the United States on 34% and the draw on 30%; the model updates as new data comes in, so the figures shifted in the two days before the match. The actual 1–4 score in Belgium's favour was recorded after the final whistle and is used here to check the forecast.
This is statistical analysis, not betting advice.
Frequently asked questions
What score did Jarvis forecast for United States vs Belgium?
The single most likely score in Jarvis's table was 1–1, at about 14.2%. The representative score was 2–1: among the scorelines in which the United States win, the outcome the model leaned towards, it was the most probable, at about 8.7%. Alongside that came an expected total of 2.78 goals and a 53% chance of three or more goals.
What were each side's chances before the match?
In the numbers locked about seven hours before kick-off, Jarvis gave the United States a 38% chance of winning, the draw 30% and Belgium 32%. That is a tight spread across the three outcomes, with neither side holding a commanding edge.
What was the final result?
The match ended United States 1–4 Belgium, a heavy win for Belgium, even though before kick-off Belgium were given only a 32% chance of winning, lower than the United States' 38%.
What did the low confidence rating on this forecast mean?
The low rating was the model's own warning before kick-off that the uncertainty around its probabilities and representative score was wider than usual. The actual 1–4, a long way from the central forecast, partly reflects that uncertainty.
Who scored in this match?
Charles De Ketelaere scored twice for Belgium (9th and 33rd minutes), with Hans Vanaken (57th minute) and Romelu Lukaku (90+3) adding the others. The United States' only goal was a direct free kick from Malik Tillman in the 31st minute.