


United States 2–0 Bosnia: how the Jarvis supercomputer's prediction held up
Nhipbong Analytics
Jarvis prediction desk

The match between the United States and Bosnia at the World Cup wrapped up 2–0 in the Americans' favor, with a clean sheet to go with it. That was also the direction the Jarvis supercomputer model leaned toward most strongly before kickoff. Let me walk through how the pre-match probability picture stacks up against what actually played out on the pitch.
- The United States beat Bosnia 2–0 and kept a clean sheet, matching the outcome Jarvis leaned toward most heavily before the match.
- Pre-match, Jarvis rated the probabilities at USA 72%, draw 19%, Bosnia 9%.
- The model's expected goals total sat around 2.4 goals; the actual match produced 2 goals, a touch below that.
- The likelihood of the match producing 3 or more goals was set at 44%, and that threshold was not reached.
- Forecast confidence for this match was flagged as LOW by Jarvis from the outset.
| Outcome | USA | Draw | Bosnia |
|---|---|---|---|
| Jarvis probability | 72% | 19% | 9% |
| Metric | Jarvis forecast |
|---|---|
| Expected total goals | 2.43 |
| Predicted score | 2-0 |
| Chance of 3+ goals | 43.8% |
Head to head: Jarvis prediction vs the actual result
| Category | Prediction (pre-match) | Actual | Correct? |
|---|---|---|---|
| Winner | USA (72%) | USA (2–0) | ✓ Right |
| Predicted score | 2–0 | 2–0 | ✓ Right |
| Expected total goals | 2.4 goals | 2 goals | ≈ Close |
| Chance of 3+ goals | 43.8% | No | ✓ Right |
United States win and keep a clean sheet
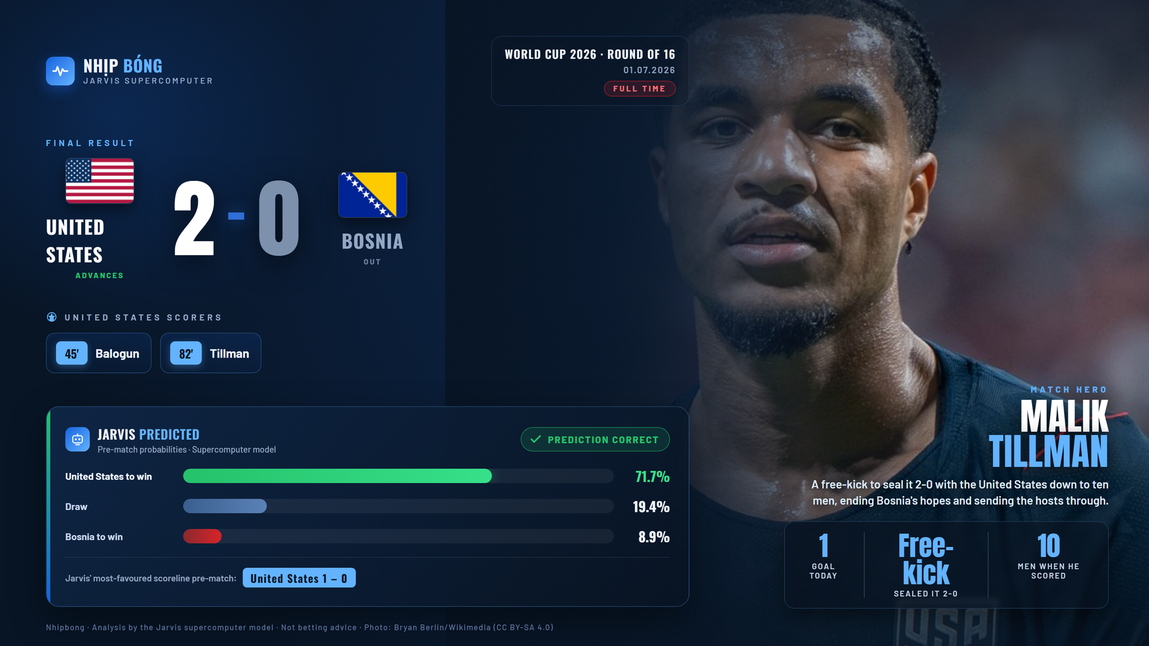
The World Cup meeting between the United States and Bosnia ended in a 2–0 win that fell entirely the Americans' way. The final whistle sent the US into the round of 16, while Bosnia went out without finding a single goal of their own.
The clearest takeaway from that 2–0 line is the clean sheet: the US defense wasn't breached once, and the side closed out the match firmly in control of the result. Folarin Balogun opened the scoring in the 45th minute. Balogun was then sent off in the 64th, but even with ten men the US found a second in the 82nd, Malik Tillman scoring from a free kick.
Key takeaways

The most obvious takeaway is a tidy, comfortable win: the United States won by a two-goal margin without conceding once. For a side the model leaned toward so clearly, a clean result like this is a convincing way to close out a match, and it lines up with the direction the pre-match probability picture pointed to.
The second takeaway concerns Bosnia. Sitting last of the three scenarios at a 9% chance of winning, Bosnia couldn't produce the spark needed for even a consolation goal. The fact that the side rated lowest by the model failed to score is a detail that fits neatly with the wide gap Jarvis had already sketched out beforehand.
Jarvis compared: pre-match forecast vs. reality


Before kickoff, the Jarvis supercomputer model laid out three probability scenarios for this match: USA to win at 72%, a draw at 19%, and Bosnia to win at 9%. The gap between the top-rated scenario and the other two was substantial, showing the model leaned quite firmly toward a United States victory.
Alongside the win-draw-loss split, Jarvis also produced a predicted score of 2–0, an expected goals total for the match of around 2.4 goals, and a 44% likelihood of the match producing 3 or more goals. It's worth being precise here: the predicted score is a figure the model uses to describe the general shape of the match, not the scoreline it judged most likely to occur exactly. Notably, the confidence level Jarvis attached to this entire forecast was LOW, meaning the model itself flagged this as a match with more unpredictable variables than usual.
Checking that against reality: the highest-probability branch, a US win, is exactly what happened. And here's the most striking detail of this comparison, the actual 2–0 scoreline landed precisely on the predicted score the model used to describe the match. That's a neat coincidence worth noting, but it shouldn't be read as the model having called the exact score outright, because with LOW confidence attached, the precise scoreline is always the part of the forecast the model is least certain about.
On the goals side, the actual total finished at 2, a touch below the roughly 2.4 goals the model expected, suggesting the match played out a little tighter than the model's average case. The 3-or-more-goals scenario, set at 44%, also didn't materialize, which is entirely normal since 44% was always a minority probability rather than the majority one.
Reading the numbers: a lopsided match with few goals

Pulled together, Jarvis's full set of numbers paints a fairly consistent picture: a side heavily favored to win, but with a modest expected goals total and a below-50% chance of a high-scoring match. In other words, the model wasn't forecasting a goal flurry, it was forecasting a match tilted toward one side and contained in terms of scoring.
Set side by side, a comfortable win by a two-goal margin with no reply from the opponent is a result that fits that shape almost perfectly. That's also why a scoreline like 2–0 was chosen as the model's predicted score: it captures all three traits at once, a clear win, a low goal count, and a clean sheet against the lower-rated side. The goals followed the same rhythm: the US only went ahead in the 45th minute and waited until the 82nd for the second, a win built patiently rather than through a burst of goals.
What the probability numbers actually mean
One point always worth repeating: 72% is not a guarantee. It's a probability the model calculated, and even when a single scenario is rated at close to three-quarters likelihood, there's always the remainder outside that 72%, here 19% for a draw and 9% for a Bosnia win, leaving room for surprises to happen on the pitch.
Jarvis flagging LOW confidence for this match is also an important part of reading these probabilities correctly. Low confidence isn't a sign the model was guessing blindly, it's the model's own way of signaling how sure it is about the finer margins of the result, things like the exact score or the total goals, in a match with more unpredictable variables than usual. Looking back at this one, the headline scenario came through, but that's still only one slice of the probability picture, not an absolute guarantee for any match in the future.
Data source
All the probability figures, the predicted score, and the expected goals total in this piece come from the Jarvis supercomputer model, calculated before kickoff. What actually happened on the pitch, the 2–0 scoreline in the United States' favor, is the real-world data checked against those numbers after the final whistle.
This is statistical analysis, not betting advice.
Frequently asked questions
What scoreline did the Jarvis model forecast for USA vs Bosnia before the match?
Jarvis laid out three probability scenarios: USA to win at 72%, a draw at 19%, and Bosnia to win at 9%, along with a predicted score of 2–0, meaning a figure that illustrates the shape of the match rather than the scoreline judged most likely to occur exactly.
What was the actual result of the USA vs Bosnia match?
The United States beat Bosnia 2–0 and kept a clean sheet.
Who scored for the United States in this match?
Folarin Balogun opened the scoring in the 45th minute and Malik Tillman made it 2–0 with a free kick in the 82nd.
How confident was the pre-match forecast for this game?
Jarvis attached a LOW confidence rating to this match well before kickoff, indicating the model itself recognized more unpredictable variables than usual, particularly around finer details like the exact scoreline.
Did Jarvis's total goals forecast match what actually happened?
The model expected around 2.4 goals for the match, while the actual total came in at 2, slightly below that figure; the 44% chance of 3 or more goals also did not play out.