


England vs Argentina prediction: the Jarvis supercomputer's verdict
Nhipbong Analytics
Jarvis prediction desk

Final score: England 1–2 Argentina. Before kick-off, the Jarvis supercomputer model leaned gently toward England across three near-level scenarios, but it was the branch rated lowest of the three that ended up coming true. The intriguing part is that on total goals and the margin of the scoreline, Jarvis got it almost exactly right. Let me walk back through the forecast and the result together.
- Final result: England 1–2 Argentina, with Argentina winning by exactly one goal.
- Jarvis before the match: England 35%, draw 34%, Argentina 31%, low confidence.
- The lowest branch (Argentina 31%) came true, but with all three scenarios so close together it was no shock.
- Predicted score 2–1 versus the actual 1–2: the same one-goal margin, the same 3-goal total.
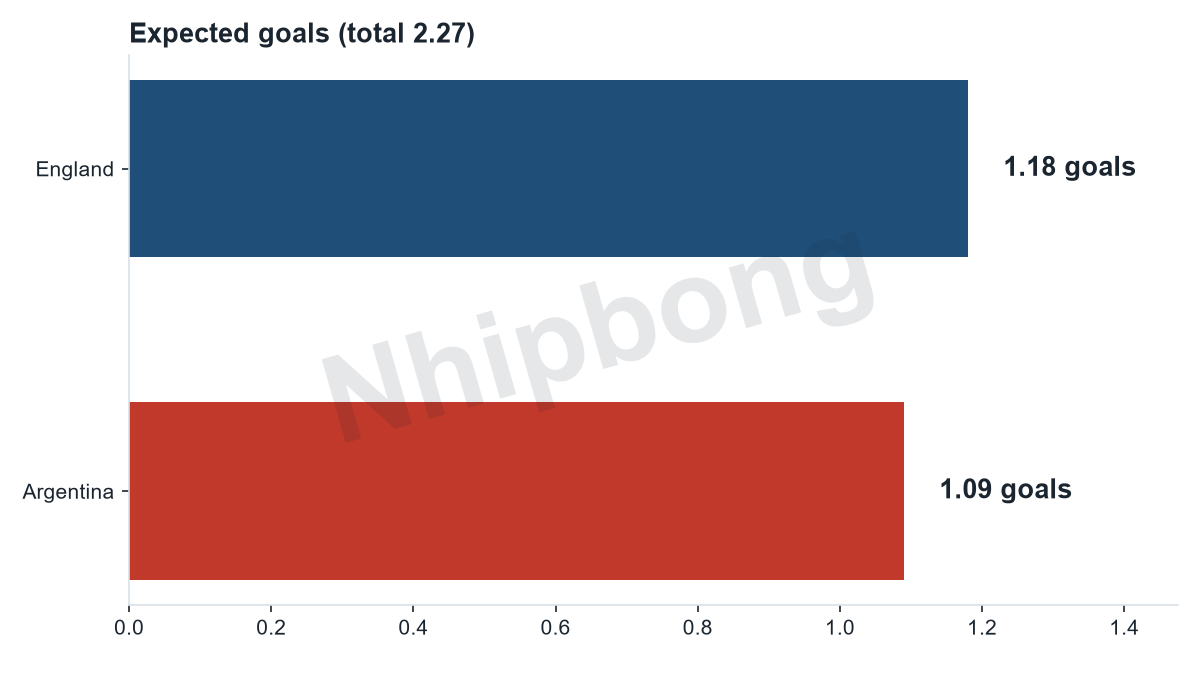
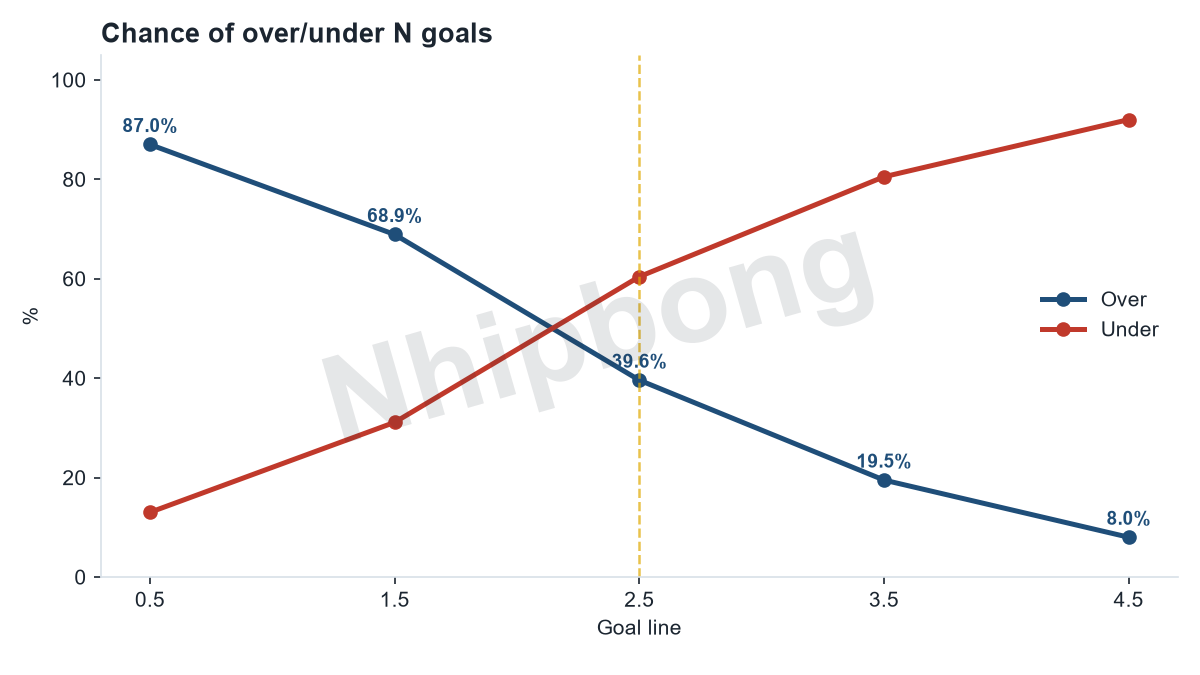
- Expected total goals of 2.27 and a 40% chance of 3 or more: the match produced exactly 3 goals, so the model nailed it.
| Outcome | England | Draw | Argentina |
|---|---|---|---|
| Jarvis probability | 35.6% | 34.1% | 30.3% |
| Metric | Jarvis forecast |
|---|---|
| Expected total goals | 2.24 |
| Predicted score | 2–1 |
| Chance of 3+ goals | 38.9% |
| Confidence | Low |
How it played out: England 1–2 Argentina
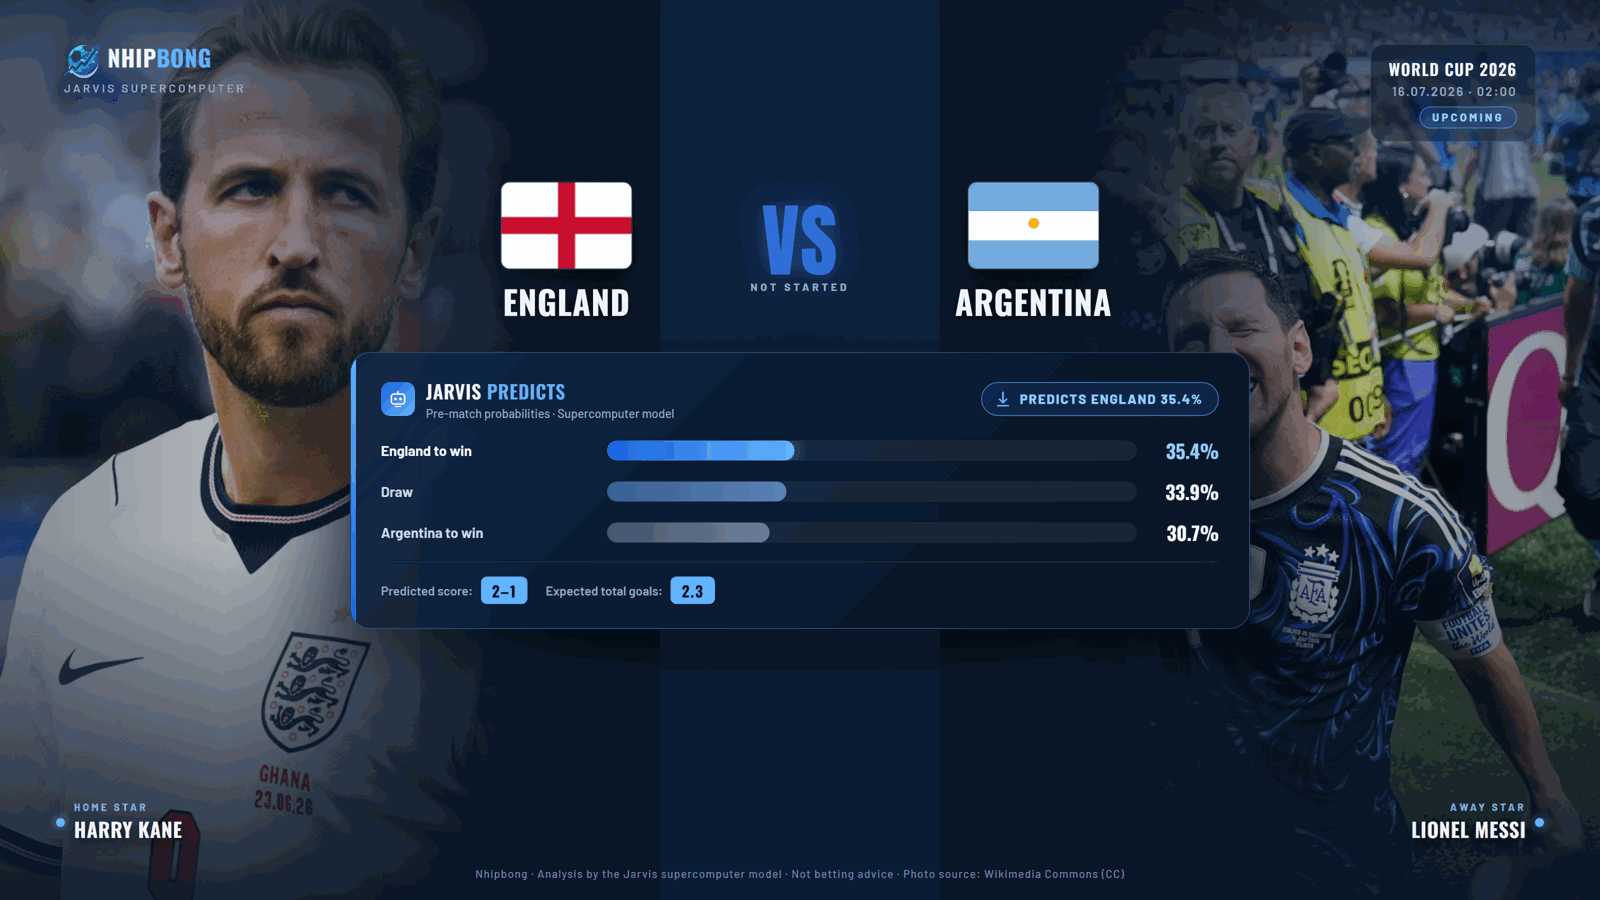

Final score: England 1–2 Argentina. This is a result piece, so let me go straight to the number that matters most: Argentina walked off with the win, edging their opponents by exactly one goal in a match that produced 3 goals in total. Before kick-off, the Jarvis supercomputer model leaned slightly toward England, but the very side it rated lowest of the three scenarios was the one celebrating at the final whistle.
England went ahead first: on 55 minutes Anthony Gordon finished from close range after a cross from Morgan Rogers. Argentina turned it around late, though. On 85 minutes, from a corner routine, Enzo Fernández took Lionel Messi's pass and drilled a low shot in from outside the box to equalise, and two minutes into stoppage time Lautaro Martínez, on as a substitute since the 81st minute, headed in Messi's cross from close range to make it 1–2. A tight result, true to the shape Jarvis had pictured beforehand, even if the winner turned out differently.
Key takeaway: the 31% branch delivered
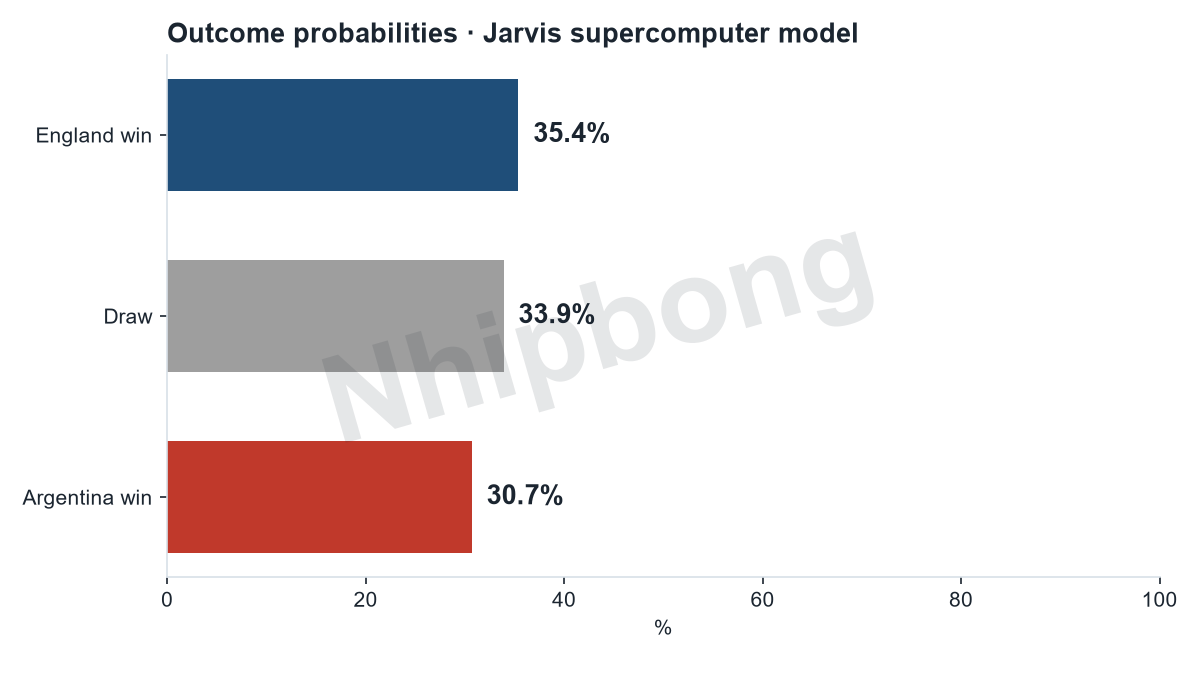
The biggest talking point is that, across three near-level scenarios, the outcome landed on the branch with the lowest probability. Jarvis rated England 35%, the draw 34% and Argentina 31%. The gap between the three numbers is only a few percentage points, meaning this was a match the model barely dared to pick a side in. In a picture that balanced, Argentina, the last of the three options, taking the win is not some irrational shock.
The second takeaway is the total number of goals. The game finished with 3 goals, right in the area Jarvis had flagged: the chance of 3 or more goals was 40%. This is one of the details the model got right, even as the eventual outcome went against its call on the winner.
Jarvis head to head: pre-match forecast versus the actual result
This is the part I most want to write carefully, because the whole point of a result piece is to answer one question: where did Jarvis get it right, and where did it get it wrong?
On the winner, the model got it wrong. Jarvis placed England top with 35%, but the side that won was Argentina, an option rated at just 31%. Even so, that number needs the right context: 35%, 34% and 31% are three figures almost glued together, and the confidence of the forecast was clearly logged as low. In other words, Jarvis never declared England would win, it only said England was the marginally stronger pick in a match the model itself found hard to read.
On the shape of the game, though, Jarvis was accurate to a surprising degree. The predicted score the model pointed toward was 2–1, meaning a one-goal margin with 3 goals in total. The actual result was 1–2: still a one-goal margin, still 3 goals in total. The model caught the margin and the goal rhythm of the match and simply flipped the winner. The expected total was 2.27 goals, and the game produced 3, a touch above expectation but comfortably inside the 40% chance of 3 or more goals the model had marked.
In short, this is the kind of result that shows what a good probabilistic forecast looks like in hindsight: the wrong winner in a match that was flagged as hard to call, but almost perfect on the scale and shape of the goals.
Tactical angle: reading the match through a probability lens

I read the match through a probability lens, set against its three goal markers: Gordon on 55 minutes, Enzo Fernández on 85 and Lautaro Martínez at 90+2. Both Argentina goals were set up by Lionel Messi.
The three-scenario frame of 35, 34 and 31 percent says one thing clearly: these are two sides the model saw as evenly matched, with neither dominant. A flat distribution like that usually corresponds to games where a single moment, one small error, is enough to tip the balance. The 1–2 result, decided by exactly one goal, fits that portrait.
An expected total of 2.27 goals suggests Jarvis pictured a game with goals in it but not a goal-fest. The actual number was 3, meaning the match was a little more open than average. The moment the balance broke is clear too: England led for half an hour, from the 55th minute to the 85th, then Argentina scored twice in the space of seven minutes. The tight contest the model sketched out took shape exactly that way on the scoreboard.
What the probability means: 31% is not a small number


Plenty of readers will finish and ask: Argentina were only given 31% and still won, so was the model wrong? This is where I want to be clear.
A number like 35% for England is not a promise that England will win. It means that if this match were played 100 times under the same conditions, England would win about 35 of them, and another scenario would occur the other 65 times. The same goes for Argentina's 31%: out of every 100 times, this side wins about 31. 31% is not so small as to be impossible, it simply sits a little behind the two other options.
So when the 31% branch came true, that isn't the model breaking down, it's probability working exactly as it should. A good forecast isn't one that always picks the winner, it's one that assigns the right level of uncertainty. In this match, the low confidence and three near-level scenarios warned in advance that every outcome was within reach.
Frequently asked questions
What was the final score of England vs Argentina?
The final score was England 1–2 Argentina. Argentina won by exactly one goal in a match that produced 3 goals in total.
Did Jarvis get the forecast right?
Partly. On the winner it was wrong, since Jarvis leaned toward England (35%) while Argentina (31%) actually won. But on the total goals and the winning margin, the model was almost completely accurate.
Argentina were only given 31% and still won, so was the model wrong?
Not really. 31% means that in 100 similar matches Argentina win about 31 of them, which is far from impossible. The three scenarios were very close together and the confidence was logged as low, so this outcome was well within the forecast.
Who scored for the two teams?
Anthony Gordon put England ahead on 55 minutes. Enzo Fernández equalised for Argentina on 85, and Lautaro Martínez headed the winner at 90+2. Lionel Messi set up both Argentina goals.
What does the predicted score 2–1 mean?
It is the predicted score the model points to in order to describe the shape of the match, not the single most likely score. It shows Jarvis pictured a one-goal margin with 3 goals in total, and the actual 1–2 matched that margin exactly.