


Ivory Coast 1–2 Norway: how the Jarvis supercomputer's prediction held up
Nhipbong Analytics
Jarvis prediction desk

Ivory Coast closed out their FIFA World Cup meeting with Norway on the wrong side of a 1–2 scoreline. Before kickoff, the Jarvis supercomputer model had placed Norway as the highest-rated outcome among three scenarios, with a predicted score pointing to 1–2. I sat down to check that whole probability picture against what actually happened on the pitch, and here is what stands out most.
- Norway beat Ivory Coast, final score 1–2.
- The result matched the scenario Jarvis rated highest before kickoff (Norway 45%).
- The 1–2 predicted score Jarvis put out before the match matched the actual final score.
- The match total of 3 goals sat close to the model's expected-goals figure of 2.59, right in the zone of the 48% three-goals-or-more scenario.
- The pre-match confidence label from Jarvis was LOW, even though the result matched across several layers of data.
| Outcome | Ivory Coast | Draw | Norway |
|---|---|---|---|
| Jarvis probability | 25% | 30% | 45% |
| Metric | Jarvis forecast |
|---|---|
| Expected total goals | 2.59 |
| Predicted score | 1-2 |
| Chance of 3+ goals | 47.9% |
Head to head: Jarvis prediction vs the actual result
| Category | Prediction (pre-match) | Actual | Correct? |
|---|---|---|---|
| Winner | Norway (45%) | Norway (1–2) | ✓ Right |
| Predicted score | 1–2 | 1–2 | ✓ Right |
| Expected total goals | 2.6 goals | 3 goals | ≈ Close |
| Chance of 3+ goals | 47.9% | Yes | ✗ Off |
How the match unfolded

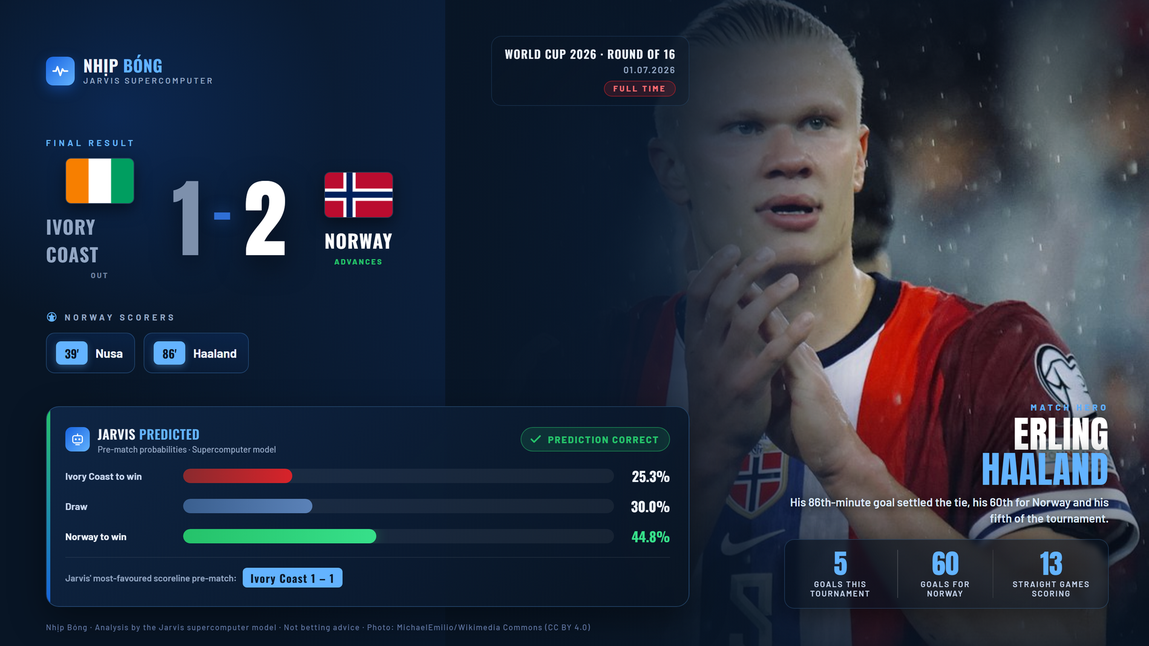
Norway struck first through Antonio Nusa in the 39th minute. Ivory Coast kept going and Amad Diallo levelled at 1–1 in the 74th minute, pulling the game back to square one. But Erling Haaland had the last word, scoring in the 86th minute to give Norway a one-goal win. Ivory Coast still got on the scoresheet, and with the match finishing on exactly 3 goals, it landed right in the scenario zone Jarvis had flagged as carrying meaningful probability before kickoff, something I dig into further in the review section below.
Post-match highlights
Looking at the summary, three things stand out. First, Norway won exactly along the line Jarvis rated highest before the match, having been assigned the top probability among the three scenarios at 45%. Second, the match finished with a total of 3 goals, sitting fairly close to the expected-goals figure the model had calculated beforehand at roughly 2.59, and landing right inside the 'three goals or more' bracket that Jarvis had put at 48%. Third, the final score of 1–2 matched the predicted score the model had produced before kickoff, a coincidence that does not happen often, since a predicted score is only meant to illustrate the direction of a match rather than serve as a goal-by-goal prediction.
Jarvis review: pre-match forecast vs actual result


This is the part I want to check most closely. Before kickoff, Jarvis put out three scenarios for this meeting: Ivory Coast to win at 25%, a draw at 30%, Norway to win at 45%. Those three figures mean Norway was the side the model rated highest, but still under 50%, meaning the lean toward Norway was a favoured tilt rather than a near-certain outcome. The actual result: Norway won, 1–2. So the scenario carrying the highest probability of the three is exactly what played out.
What stands out even more is the second layer of data: the predicted score Jarvis produced before the match was 1–2, and that is precisely what happened on the pitch. Worth repeating here, a predicted score is not the score the model considers most likely in the sense of probability across every individual scoreline, but rather a figure used to illustrate the direction of the match, meaning who is favoured, by how many goals, and whether the total goal count runs high or low. This illustrative figure matching the real result is a coincidence worth noting, not something that should be read as the model 'predicting the score' in the ordinary sense.
The point that most calls for a level head: the confidence rating on this forecast was labelled LOW by Jarvis from the outset, before the match was even played. That means even though the result matched almost perfectly across all three layers, the winning side, the goal total, and the score itself, the model itself had already flagged this as a case carrying higher-than-usual uncertainty. A clean match on the numbers does not mean this forecast was 'easy' or 'safe'. If anything, the model had been explicit up front that its own certainty here was low.
Total goals matched the expected range


The third layer worth checking is the total goal count. Before the match, Jarvis set the expected goals for the game at roughly 2.59 and assigned a 48% chance of the match finishing with three goals or more. On the pitch, the two sides combined for exactly 3 goals, Ivory Coast 1 and Norway 2, landing squarely inside the higher-scoring bracket the model was leaning toward. What I find worth pointing out is how well it reflects the nature of a three-scenario framework: a side rated lower on the final outcome, such as Ivory Coast with only a 25% chance of winning, does not mean that side draws a blank altogether, and indeed they still contributed 1 goal to the match total. Amad Diallo's 74th-minute equaliser is the clearest proof of that, and it took Haaland's goal in the 86th minute for the Norway win Jarvis leaned toward to finally take shape.
What the probability figures actually mean
To close out, I want to come back to the word LOW that Jarvis attached to this case itself, because that is the detail most likely to get overlooked once a result has matched this cleanly. A low confidence label means the model is warning in advance that its own margin of error runs wider than usual, so a hit like this one should be read as a result falling inside a zone the model had flagged, not as proof that the forecast was ever a sure thing. Put another way, being right once does not turn a LOW case into a reliable one, and it does not promise the same outcome will repeat next time. To me, this is the healthiest way to read every number Jarvis puts out: the highest-rated scenario is still only the highest among several possibilities, everything else remains on the table, and the confidence label is a reminder to stay modest even when, this time around, every layer of data happened to point the same way.
Data sources
All the probability figures, expected goals and predicted score referenced in this article come from the Jarvis supercomputer model, calculated and recorded before the Ivory Coast vs Norway match kicked off. The actual result, Ivory Coast 1–2 Norway, is what played out on the pitch once the match had finished. The scorers and goal times (Nusa 39', Amad Diallo 74', Haaland 86') come from the match record after the final whistle. This is statistical analysis, not betting advice.
Frequently asked questions
Which side did Jarvis rate as most likely to win before the match?
Norway, at 45% across the three scenarios the model produced (Ivory Coast to win 25%, draw 30%, Norway to win 45%).
What was the predicted score Jarvis put out before the match, and did it match the actual result?
The predicted score was 1–2, and the actual result was also Ivory Coast 1–2 Norway, an exact match.
Did the actual total goal count come close to what Jarvis calculated before the match?
Yes. Jarvis put the expected goals for the match at roughly 2.59, and the match finished with 3 goals, fairly close to that expected figure, and landing inside the 'three goals or more' bracket the model had put at 48%.
Why was the confidence rating on this forecast labelled low?
This is a confidence rating the Jarvis model assigns to itself before the match. The label does not explain the scoreline, it describes how certain the forecast was. Even though the result later matched across several layers of data, the model itself had flagged this in advance as a case carrying higher-than-usual uncertainty.
Who scored in Ivory Coast vs Norway?
Antonio Nusa put Norway ahead in the 39th minute, Amad Diallo equalised for Ivory Coast in the 74th, and Erling Haaland scored the winner in the 86th.