


England 2–1 DR Congo: how the Jarvis supercomputer's prediction held up
Nhipbong Analytics
Jarvis prediction desk

England beat DR Congo 2–1 at the FIFA World Cup, matching the lean of the Jarvis supercomputer model ahead of kickoff. But England had to come from behind: Brian Cipenga put DR Congo ahead in the 7th minute, and it took two goals from Harry Kane, in the 75th and 86th minutes, to turn the game around. This piece is a check: how accurate was Jarvis's pre-match probability picture, and where exactly did reality diverge from the forecast.
- England beat DR Congo 2–1 at the World Cup, matching Jarvis's pre-match lean, which gave the England-win scenario the highest probability at 77%.
- The actual total of 3 goals landed almost exactly on the 2.5296 expected-goals figure Jarvis calculated before kickoff.
- The scenario of 3 or more goals, given a 46% probability by Jarvis before the match, is exactly what happened.
- The model's predicted score was 2–0; the actual result came in one goal off at 2–1 after DR Congo found the net.
- Jarvis tagged this forecast with a LOW confidence label from the start, effectively flagging high uncertainty in advance, so the tight final score isn't a surprise.
| Outcome | England | Draw | DR Congo |
|---|---|---|---|
| Jarvis probability | 77% | 17% | 6% |
| Metric | Jarvis forecast |
|---|---|
| Expected total goals | 2.53 |
| Predicted score | 2-0 |
| Chance of 3+ goals | 46.4% |
Head to head: Jarvis prediction vs the actual result
| Category | Prediction (pre-match) | Actual | Correct? |
|---|---|---|---|
| Winner | England (77%) | England (2–1) | ✓ Right |
| Predicted score | 2–0 | 2–1 | ✗ Off |
| Expected total goals | 2.5 goals | 3 goals | ≈ Close |
| Chance of 3+ goals | 46.4% | Yes | ✗ Off |
Jarvis Called the Winner, DR Congo Rewrote the Scoreline
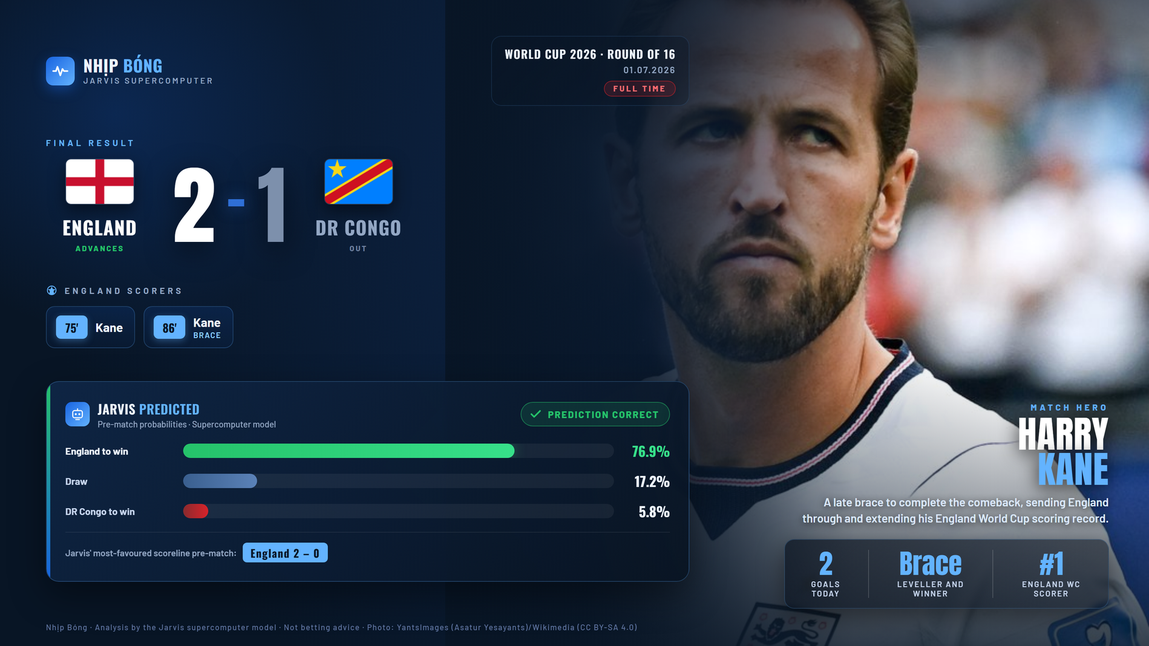
Before kickoff, the Jarvis supercomputer model split this match into three scenarios and leaned firmly one way: England to win at 77%, a draw at 17%, and DR Congo to win at 6%. The final score, a 2–1 England win, landed squarely in the scenario the model rated most likely, so on the question of who would win, this is a match where Jarvis got it right. But what stands out from this game isn't which side won, it's what the scoreline looked like.
Alongside those three win, draw and loss scenarios, Jarvis also produced a predicted score the model was pointing toward: 2–0. To be clear, this isn't meant as the single most likely exact scoreline, it's the central reference point that sums up the overall lean of the full probability set. The actual match finished 2–1, one goal off that reference point. And that one-goal gap belonged to DR Congo, the side the model gave just 6% to for an outright win.
A team sitting in the low-probability bracket still finding the net doesn't break the forecast, it falls well within the normal range of outcomes a probability framework like this allows for. Jarvis leaned toward England on the final result, but it never claimed England would keep a clean sheet. Put simply, the model got the winner right, while DR Congo is the side that rewrote the script, scoring first in the 7th minute and forcing England to come from behind.
The Total-Goals Picture Held Up Even Better Than the Scoreline
If the scoreline shows a one-goal gap, the total-goals numbers are where Jarvis stayed very close to reality. Before the match, the model rated in an expected total of 2.5296 goals for both sides combined. The game finished with 3 goals, a difference of well under half a goal from that expected figure, a small margin of error for a football forecast that inherently carries plenty of variance.
Alongside that expected-goals figure, Jarvis gave a 46% chance to the match producing 3 goals or more, essentially just under a coin flip. That scenario played out exactly at the 3-goal threshold, split as 2 goals for England and 1 for DR Congo. What's interesting is that within the same match, the forecast for how many goals would be scored held up better than the forecast for how those goals would be shared between the two sides.
This is something I always pay attention to when reviewing a forecast after the fact: a model can nail one layer of information while drifting slightly on another. Separating those two layers, total goals on one side, the exact scoreline on the other, makes for a far fairer read than lumping everything together and handing out a single right-or-wrong verdict.
The LOW Label: Jarvis Flagged This One in Advance


There's a detail that's easy to skim past but matters for reading this result correctly: from the outset, Jarvis attached a LOW confidence label to this forecast. That label doesn't describe the scoreline, it describes how certain the model itself was. In other words, before a ball was kicked, Jarvis had already acknowledged this was a forecast carrying more uncertainty than usual.
It's worth being precise here to avoid misreading it. The LOW label reflects the model's own uncertainty, it is not the reason the scoreline ended up tight, it didn't put DR Congo's goal in the net. What it did do was signal in advance that a result diverging from the best-case scenario was well within the range of possibility. So when the match settled at a tight 2–1 rather than a comfortable win, that wasn't a shock, it's exactly the kind of outcome a forecast already flagged as less certain leaves room for.
Reading the Probability Numbers the Right Way


This is the point I raise in every one of these post-match reviews. The 77% attached to England isn't a promise of the outcome, it's how strongly the model leaned toward one of three scenarios based on the data available before kickoff. Sitting alongside it is always the remaining 23%, split between the other two scenarios, and this match is a reminder that the 23% is never meaningless.
Because of that, the most useful way to read these numbers isn't to spot the highest figure and assume the match is a foregone conclusion, it's to read all three scenarios together, alongside the expected-goals figure and the confidence label attached to them. Seen that way, the picture before kickoff was already far more open than the headline percentage alone suggests, and a 2–1 result is simply one of the shapes that picture always allowed for.
Data Sources and Notes
All the forecast figures in this article, the three-scenario probabilities, the predicted score, the expected goals total, the likelihood of 3 or more goals, and the confidence rating, come from the Jarvis supercomputer model, calculated before the match kicked off. The actual 2–1 final score is the result used for comparison; the scorers and goal times (Cipenga at 7, Kane at 75 and 86) come from the match record.
This is statistical analysis, not betting advice.
Frequently asked questions
What did Jarvis forecast for England vs DR Congo before kickoff?
Before the match, the Jarvis model rated England to win at 77%, a draw at 17%, and DR Congo to win at 6%, with a predicted score of 2–0, an expected goals total of 2.5296, and a confidence rating of LOW.
What was the actual result of the match?
England beat DR Congo 2–1. Brian Cipenga gave DR Congo the lead in the 7th minute, Harry Kane equalised in the 75th and then scored the winner in the 86th.
Was Jarvis's forecast accurate?
Accurate on the outcome, since the England-win scenario, rated the highest probability at 77%, is what happened. But the actual 2–1 score is one goal off the 2–0 predicted score the model used as its reference point.
Why did DR Congo score a goal despite being rated at just 6%?
That 6% is the probability of DR Congo winning the match outright, not the probability of them failing to score at all. A team rated as a heavy underdog to win can still find the net, and that's exactly what happened.
Why was this match given a LOW confidence rating?
That label was attached by the Jarvis model itself before kickoff, reflecting higher-than-usual uncertainty in this particular forecast. It's a signal about how confident the model was, not a cause of the scoreline. In this match, that warning showed in DR Congo holding the lead until the 75th minute.