


Norway 1–2 England: how the Jarvis supercomputer's prediction held up
Nhipbong Analytics
Jarvis prediction desk

A World Cup knockout tie that ran all the way to the 121st minute, and the final Norway 1–2 England matched the predicted score of 1–2 that the Jarvis supercomputer model picked before kickoff. Jarvis leaned towards England at 51% pre-match, and England did go through, but only after a full, nervy period of extra time. Here I put each pre-match number side by side with what actually happened on the pitch.
- England beat Norway 2–1, with the match decided in extra time and finishing in the 121st minute.
- Before kick-off, Jarvis rated England at 51%, Norway at 22%, and a draw at 27%, with the forecast's confidence level marked LOW.
- The predicted score Jarvis put forward before the match was 1–2 in England's favour, matching the actual final score.
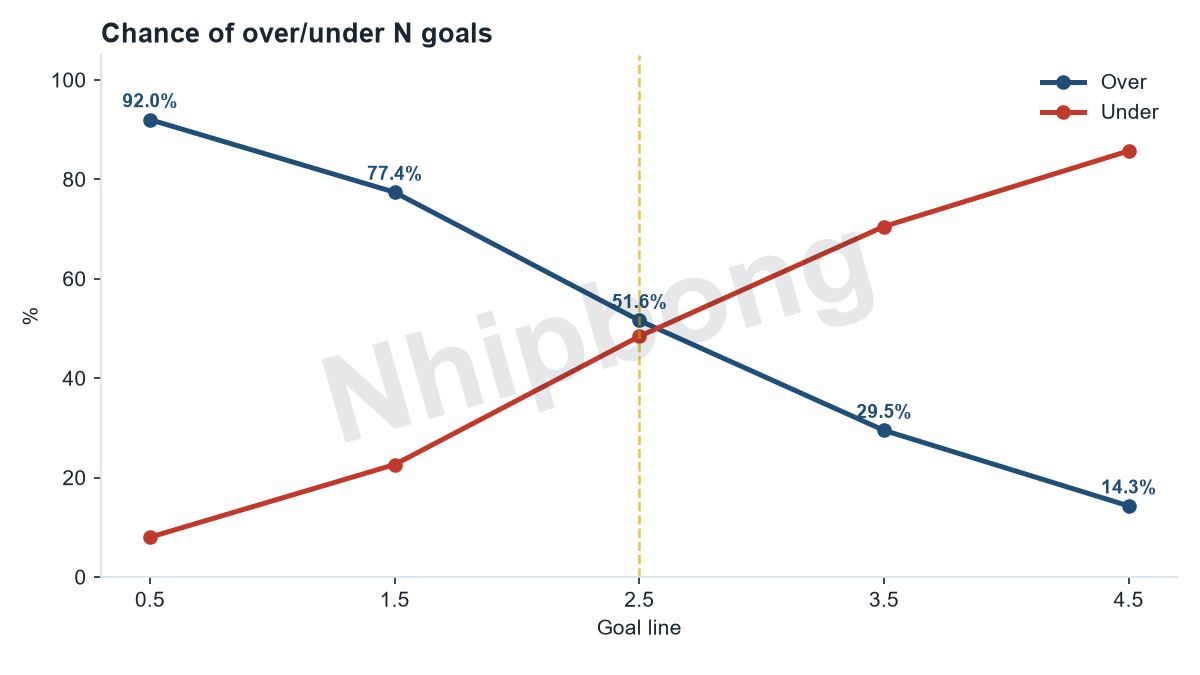
- 3 goals were scored in the match, clearing the 2.5-goal line that the model gave a 52% chance of happening.
- Both teams scored, matching the 54% probability Jarvis assigned before kick-off.
| Outcome | Norway | Draw | England |
|---|---|---|---|
| Jarvis probability | 22% | 27% | 51% |
| Metric | Jarvis forecast |
|---|---|
| Expected total goals | 2.74 |
| Predicted score | 1-2 |
| Chance of 3+ goals | 51.6% |
Head to head: Jarvis prediction vs the actual result
| Category | Prediction (pre-match) | Actual | Correct? |
|---|---|---|---|
| Winner | England (51%) | England (1–2) | ✓ Right |
| Predicted score | 1–2 | 1–2 | ✓ Right |
| Expected total goals | 2.7 goals | 3 goals | ≈ Close |
| Chance of 3+ goals | 51.6% | Yes | ✓ Right |
How the match unfolded

The World Cup knockout match between Norway and England closed out with a 2–1 win for England, but the team needed the full stretch of extra time to shut the door on Norway. The game didn't end until the 121st minute, meaning the regulation 90 minutes weren't enough to separate the two sides, and they had to settle it in extra time under the tournament's knockout format.
Norway struck first through Andreas Schjelderup in the 36th minute. Jude Bellingham equalised in first-half stoppage time (45+2), and 1–1 held until the end of the 90. In extra time, Bellingham scored again in the 93rd minute to send England through with a 2–1 win, while Norway's run ended there. This was not the straightforward win that some might have pictured before kick-off.
The weight of a knockout tie that ran to the 121st minute
In a knockout match, what matters most isn't just who won, it's how hard-fought that win was. England went in as the side rated highest, but the regulation 90 minutes weren't enough to turn that edge on paper into a spot in the next round. It took a complete extra period: England went ahead in the 93rd minute but still had to hold on until the 121st minute to be safe. That's the gap between being the favourite in a model and being the favourite in real life: the latter had to be paid for with almost another half hour of tense football before the result was secure.
A margin of just one goal underlines that further. In knockout football, a single goal is about as thin a margin as there is, thin enough that one moment can flip everything right up until the closing minutes of extra time. England got the result that mattered, but a contest this tight, one that needed a full extra period to resolve, is exactly the kind of scenario that a single pre-match probability can never fully capture on its own, and that leads me to the most important comparison in this piece.
Jarvis compared: pre-match forecast vs the actual result


Before kick-off, the Jarvis supercomputer model laid out three scenarios for this match: Norway was given a 22% chance, a draw was assigned 27%, and England came out as the highest-rated side at 51%. That's a set of probabilities that leaned toward England without being one-sided, 51% is far from overwhelming, and the model also tagged this forecast's confidence level as LOW. Looking back at the final result, England were indeed the side that won, exactly as the highest-probability scenario Jarvis put forward suggested. But the way the match played out, needing extra time all the way to the 121st minute, lines up perfectly with that very LOW-confidence warning. A 51% scenario isn't a guaranteed outcome, it's simply the most probable of the three options, and this match travelled the bumpy road that the LOW label had quietly flagged in advance.
On the scoreline, the model's predicted score beforehand was 1–2 in England's favour, and the actual final score was also Norway 1–2 England. That's a notable match at the final number. One detail matters here: the score after the regulation 90 minutes was still 1–1, and the 1–2 was only locked in when Jude Bellingham scored in the 93rd minute, early in extra time. Even so, the final number on the scoreboard matches the predicted score the model put forward before the match.
Reading the match through the goals framework

Beyond the win-loss result, Jarvis also put out two other quantitative signals before the match: a 52% chance of the match producing more than 2.5 goals, and a 54% chance of both teams scoring. The Norway 1–2 England result confirms both. A total of 3 goals were scored, clearing the 2.5-goal line the model leaned toward at just over half; at the same time, both teams found the net, matching the 54% scenario. Both markers can be checked straight against the result, and both landed on the side Jarvis had leaned toward beforehand.
What the probability numbers mean
The lesson worth taking from this match isn't in the result, it's in how to read a forecast. A number like 51% always comes with a confidence label, and that label is what tells you how much weight to put on the number itself. In Norway against England, the LOW label was a reminder that the gap between the three scenarios was narrow enough for things to swing the other way, and the match being dragged out to the 121st minute showed exactly that level of difficulty.
Applying this to future matches, the useful way to read a forecast is to pair the number with its label rather than just looking at which side has the higher percentage. The same 51% figure, if paired with a HIGH label, is far more trustworthy than when it's paired with a LOW label like in this match. In other words, the percentage tells you which way the model leans, while the confidence label tells you how much to lean with it. A match tagged LOW is one worth bracing for any scenario, including one that needs extra time to settle, exactly what Norway and England just went through.
Data source and notes
All the forecast figures in this article, including the pre-match probabilities, the predicted score, the over 2.5 goals chance, and the both-teams-to-score chance, were calculated by the Jarvis supercomputer model before the match kicked off. The final score of Norway 1–2 England along with the match ending in the 121st minute is post-match data, used here for comparison against the forecast. The scorers and goal times (Schjelderup at 36, Bellingham at 45+2 and 93) come from the match record. This is statistical analysis, not betting advice.
Frequently asked questions
What was the final score in the Norway vs England match?
England beat Norway 2–1 after extra time, with the match finishing in the 121st minute.
Before the match, which team did the Jarvis model rate as more likely to win?
Jarvis rated England as the most likely winner at 51%, while Norway was rated at 22% and a draw at 27%. The model tagged this forecast's confidence level as LOW.
Did the predicted score Jarvis forecast before the match match reality?
Yes. The predicted score the model put forward before the match was 1–2 in England's favour, and the actual final score was also Norway 1–2 England.
Did the match produce as many goals as forecast?
Partly, yes. Jarvis forecast a 52% chance of the match producing more than 2.5 goals, and in fact 3 goals were scored. The model also forecast a 54% chance of both teams scoring, and that also happened.
Who scored the goals in this match?
Andreas Schjelderup put Norway ahead in the 36th minute. Jude Bellingham scored both England goals: the 1–1 equaliser in first-half stoppage time (45+2) and the winner in the 93rd minute of extra time.