


Spain 2–1 Belgium: how the Jarvis supercomputer's prediction held up
Nhipbong Analytics
Jarvis prediction desk

Spain beat Belgium 2–1 at the FIFA World Cup, matching the way the Jarvis supercomputer model leaned before kick-off. Fabián Ruiz opened the scoring on 30 minutes, Charles De Ketelaere equalised for Belgium on 41, and Mikel Merino scored the winner on 88. This piece focuses on the comparison: how well Jarvis's pre-match probability picture held up, and where reality drifted from the forecast.
- Spain beat Belgium 2–1 at the World Cup, in line with Jarvis's forecast, which gave the Spain-win scenario the highest probability at 58.4%.
- The actual goal total was 3, close to the 2.68 goals Jarvis expected before kick-off.
- The scenario of three or more goals, which Jarvis put at 50.2% before the match, came to pass.
- The predicted scoreline the model pointed towards was 2–0; reality was one goal off at 2–1 because Belgium equalised on 41.
- Jarvis flagged low confidence from the outset, effectively warning in advance that this was an uncertain match, so a tight result was no shock.
| Outcome | Spain | Draw | Belgium |
|---|---|---|---|
| Jarvis probability | 58% | 26% | 16% |
| Metric | Jarvis forecast |
|---|---|
| Expected total goals | 2.68 |
| Predicted score | 2-0 |
| Chance of 3+ goals | 50.2% |
Head to head: Jarvis prediction vs the actual result
| Category | Prediction (pre-match) | Actual | Correct? |
|---|---|---|---|
| Winner | Spain (58%) | Spain (2–1) | ✓ Right |
| Predicted score | 2–0 | 2–1 | ✗ Off |
| Expected total goals | 2.7 goals | 3 goals | ≈ Close |
| Chance of 3+ goals | 50.2% | Yes | ✓ Right |
Spain won 2–1, matching Jarvis's lean
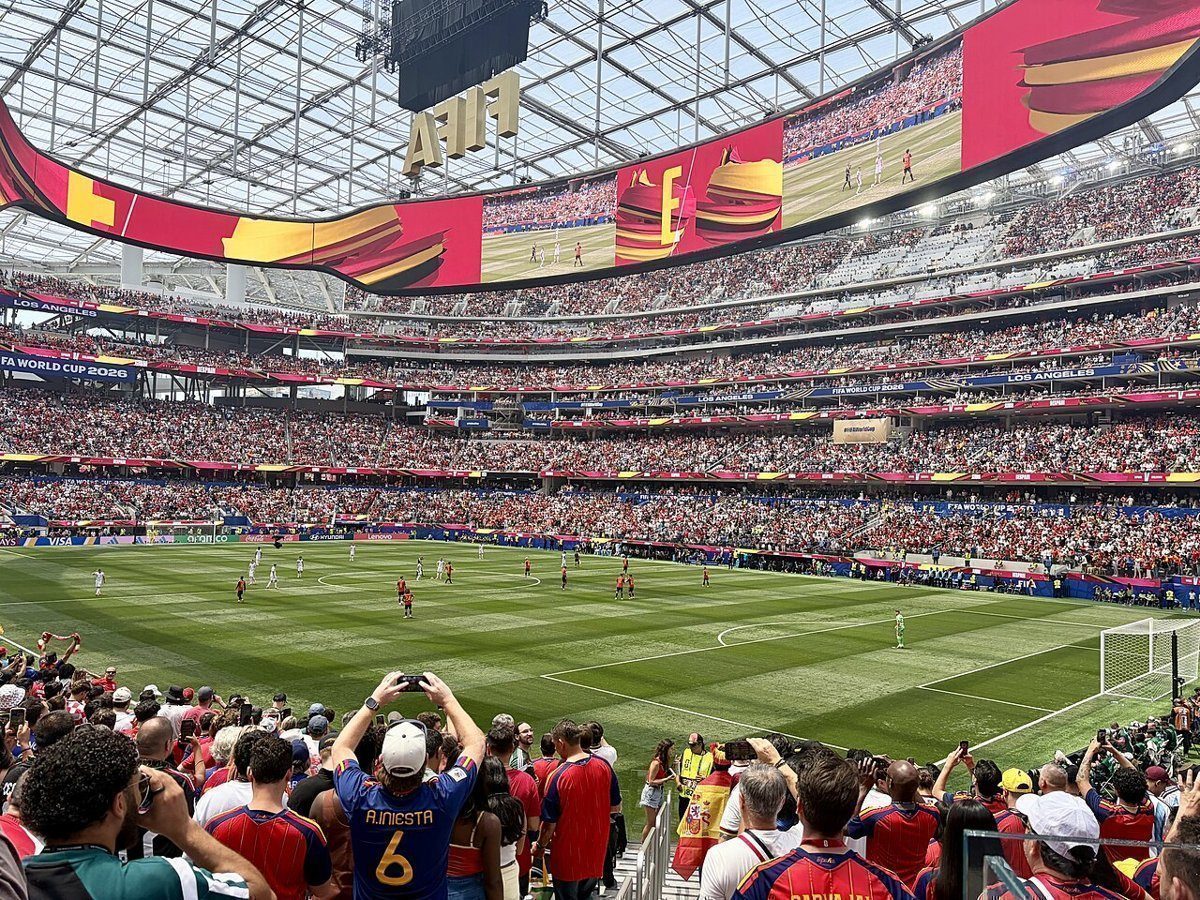

Spain beat Belgium 2–1 at the FIFA World Cup, landing squarely in the scenario the Jarvis supercomputer model leaned towards before kick-off. Fabián Ruiz put Spain ahead on 30 minutes, Charles De Ketelaere equalised for Belgium on 41, and that balance held until the 88th, when Mikel Merino scored the winner.
The rest of this piece does exactly what a post-match comparison should: it sets Jarvis's pre-match forecast next to the actual result to see how far the model got it right and where it missed. Spain won, in line with the model's lean, but Belgium, the side rated lower, made them wait until the closing minutes for the winner. That detail alone makes this comparison more interesting than a routine one-sided win.
Talking points: Belgium's goal and three goals on the night
The biggest talking point of the match is Belgium's goal. Before kick-off Jarvis gave just 16.1% to the scenario of a Belgium win, placing them clearly in the lower-rated bracket. Yet Belgium still breached Spain's defence once, enough to turn what might have been a comfortable win into a tight result. For a side rated below their opponents like Belgium, scoring against a stronger Spain is a detail worth noting, even if it wasn't enough to change the outcome.
The second talking point is the goal total: three goals in all, split 2 for Spain and 1 for Belgium. That figure of 3 is no small thing set against the total the model expected beforehand, and I'll go into it in the comparison just below. At the simplest level of feel, this was a match with goals at both ends rather than a dull one-way affair.
Jarvis compared: the pre-match forecast against the actual result


This is the backbone of the article, so I'll take it layer by layer. On the result, Jarvis leaned firmly towards Spain with a 58.4% chance of a win, well clear of 25.5% for a draw and 16.1% for Belgium. The final result, a 2–1 Spain win, landed exactly in the scenario given the highest probability, so on the most basic question of who wins, the model got it right.
On the scoreline, the story is more nuanced. The predicted score the model pointed towards was 2–0, and I always stress that this is a reference point wrapping up the overall tilt of the whole probability set, not the single most likely score. Reality finished 2–1, one goal off that reference point. And that one-goal gap is precisely Belgium's goal, from the side the model gave only 16.1% to win. A team in the lower-probability bracket still scoring doesn't break the forecast at all; it sits comfortably within the reasonable spread of a probability picture.
On the goal total, Jarvis stayed fairly close. Before the match the model put the expected figure at around 2.68 goals for both sides combined; the game ended with 3 goals, a gap of less than half a goal, a small error for a football forecast that is inherently volatile. Alongside that figure, the chance of three or more goals was set at 50.2%, exactly even, and that scenario became reality right at the 3-goal mark. Finally, it's worth noting that Jarvis attached a low confidence label to this call, meaning it flagged in advance that this was an uncertain match, so a tight result rather than a comfortable one is no shock.
Reading the match through the probability picture and the goals line

Reading this match through the exact set of numbers Jarvis put out beforehand, I see an interesting tension between two signals. On one hand, the 2–0 predicted score suggests a clean win with the opponent kept off the scoresheet. On the other, the chance of three or more goals was set at exactly 50.2%, meaning the model also saw a coin-flip chance of an open, goal-filled match. Those two signals don't contradict each other if you take 2–0 as merely the midpoint of a wide distribution.
The actual 2–1 landed right in the reconciling zone between the two signals: Spain still won, as the main lean suggested, but the match produced three goals with strikes at both ends, in keeping with the even chance of an open game the model left on the table. The goal times show the match stayed level for longer than the scoreline suggests: 1–1 from the 41st minute to the 88th, before Mikel Merino made the difference.
Reading the 58.4% correctly
This is the part I bring up in every comparison. The 58.4% for Spain isn't a promise about the outcome; it's how far the model leaned towards one of three scenarios based on the data available before kick-off. It always comes with the rest split between the draw chance 25.5% and the chance of a Belgium win. Spain did indeed win this one, but Belgium's goal is a reminder that the leftover probability was never meaningless.
The most useful way to read it isn't to look at the highest number and conclude the match will be one-sided, but to read all three scenarios at once, along with the expected goal total and the low confidence label that came with them. Seen that way, a 2–1 result is just one of the shapes the pre-match picture already allowed for, not a swing away from the forecast.
Data sources and notes

All the forecast figures in this article, including the three-scenario probabilities, the predicted score, the expected goal total, the chance of three or more goals and the confidence level, come from the Jarvis supercomputer model and were calculated before the match was played. The actual 2–1 score is the final result used for comparison; the scorers and goal times (Fabián Ruiz in the 30th minute, De Ketelaere in the 41st, Merino in the 88th) come from the match record.
This is statistical analysis, not betting advice.
Frequently asked questions
How did Jarvis forecast Spain vs Belgium before the match?
Before kick-off, the Jarvis model gave Spain a 58.4% chance of winning, a draw 25.5% and a Belgium win 16.1%, with a predicted score the model pointed towards of 2–0, an expected goal total of around 2.68 and a confidence level flagged as low.
What was the actual result of the match?
Spain beat Belgium 2–1. Fabián Ruiz opened the scoring on 30 minutes, Charles De Ketelaere equalised for Belgium on 41, and Mikel Merino scored the winner on 88.
Was Jarvis's forecast correct?
It was right on the result, since the Spain-win scenario, given the highest probability at 58.4%, is what happened. But the actual 2–1 was one goal off the 2–0 predicted score the model offered as a reference point.
Why did Belgium, rated at only 16.1%, still score?
16.1% is the probability of a Belgium win over the whole match, not the probability that they'd fail to score at all. A side rated low on the win-loss outcome can still get on the scoresheet, and that's what happened.
Why was this match labelled low confidence?
This is a label the Jarvis model itself attached before the match, reflecting the higher uncertainty of this forecast. It's a signal about how sure the model is, not a cause of the scoreline. In this match, that warning showed in the score staying level at 1–1 until the 88th minute.