


France 0–2 Spain: how the Jarvis supercomputer's prediction held up
Nhipbong Analytics
Jarvis prediction desk

A World Cup match that the Jarvis supercomputer model read as a coin toss ended in a way that was anything but balanced: France 0–2 Spain. Before kick-off France sat narrowly on top at 38%, yet it was Spain, the side carrying the lowest probability at 30%, that walked off with a tidy win. I'll set the forecast next to the actual result to see where Jarvis got it right and where it drifted.
- France 0–2 Spain, with Spain keeping a clean sheet.
- Before kick-off Jarvis leaned slightly toward France: 38% against Spain's 30%, with the draw at 32%.
- The 2–1 predicted scoreline that favoured France flipped into 0–2 for Spain.
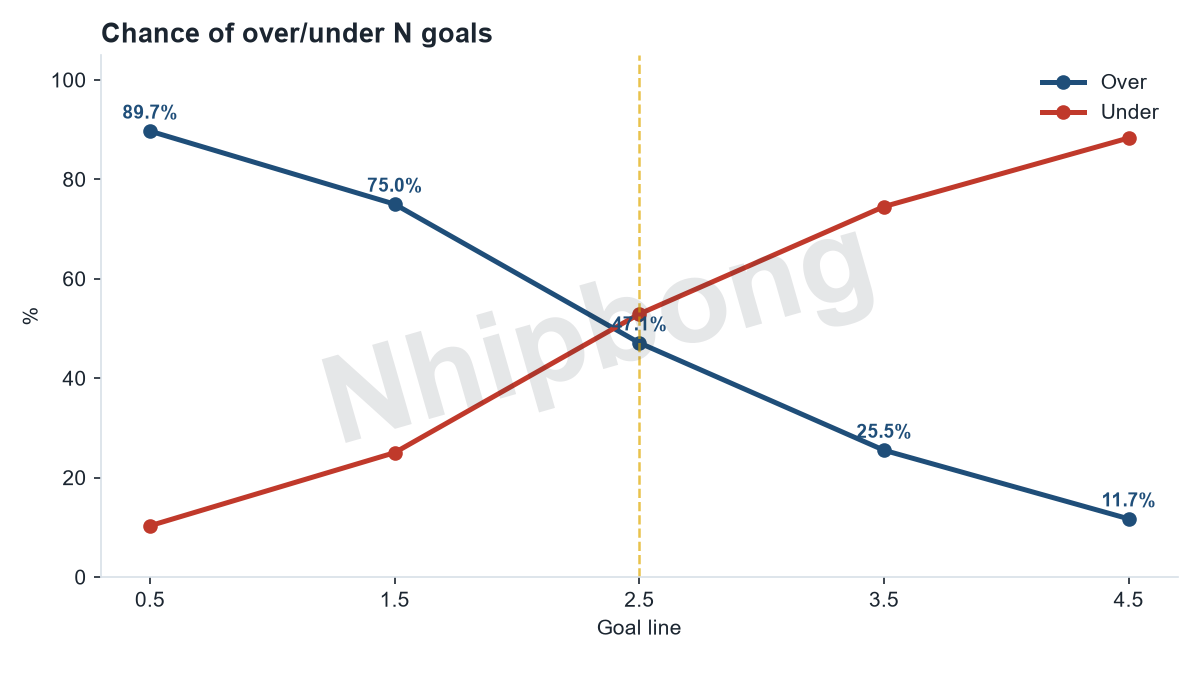
- The expected total of 2.56 goals sat very close to the 2 actually scored; the three-or-more-goals scenario (47%) didn't come off.
- The Low confidence label shows the model had flagged the unpredictability in advance.
| Outcome | France | Draw | Spain |
|---|---|---|---|
| Jarvis probability | 38% | 32% | 30% |
| Metric | Jarvis forecast |
|---|---|
| Expected total goals | 2.56 |
| Predicted score | 2-1 |
| Chance of 3+ goals | 47.1% |
Head to head: Jarvis prediction vs the actual result
| Category | Prediction (pre-match) | Actual | Correct? |
|---|---|---|---|
| Winner | France (38%) | Spain (0–2) | ✗ Off |
| Predicted score | 2–1 | 0–2 | ✗ Off |
| Expected total goals | 2.6 goals | 2 goals | ≈ Close |
| Chance of 3+ goals | 47.1% | No | ✓ Right |
How it played out: Spain's tidy 0–2 win

The match closed out at France 0–2 Spain. The result tells me one thing clearly: Spain were the side that left the pitch with everything to smile about, while France couldn't breach their opponents' net even once. Mikel Oyarzabal opened the scoring from the penalty spot on 22 minutes, and Pedro Porro doubled the lead on 58.
The final scoreboard tells the story: a two-goal margin, a clean sheet for Spain, and a quiet evening for the France attack. For a World Cup tie between two major footballing nations, a 0–2 gap is enough to count as a convincing win that tilts firmly to one side.
The talking points: a clean sheet and a France attack that went quiet
The biggest talking point, for me, is Spain's clean sheet. In a match expected to bring around 2.56 goals in total, one side keeping its own goal intact while still scoring twice is an almost perfectly balanced outcome in scoreline terms.
At the other end, the 0 next to France is what really stands out. A team the model rated slightly higher before kick-off drew a blank, and that's the gap between expectation and reality I'll dig into more in the comparison section. The match produced 2 goals in all, below the 3-goal threshold plenty of people were waiting for. A tidy result on paper, but one that holds plenty to chew over once you set it beside the forecast.
Jarvis compared: the pre-match forecast against the actual result


This is the part I want to linger on longest. Before the match, the Jarvis supercomputer model laid out three fairly tight scenarios: France to win at 38%, the draw at 32%, and Spain to win at 30%. Put another way, France were rated highest, but that edge was wafer-thin, just 8 percentage points clear of Spain. The predicted scoreline the model leaned toward was 2–1 in France's favour, the expected total was around 2.56 goals, and the chance of the game bringing 3 or more goals stood at 47%. Notably, Jarvis attached a Low confidence label to this one, an admission that the model itself wasn't sure.
Now set that against reality: France 0–2 Spain. The side the model ranked lowest of the three scenarios turned out to be the winner, and won at a distance. The 2–1 predicted scoreline favouring France flipped completely into 0–2 favouring Spain. On goals, the model expected around 2.56 and the game delivered exactly 2, so the goals forecast was actually very close. The three-or-more-goals scenario, at 47%, didn't come off, and that always sat within the larger 53% on the other side. In short, Jarvis read the goal count correctly but got the winner wrong, and that Low confidence label turned out to be a warning worth its weight.
The tactical angle: reading it through the probability frame

On the tactical side, I read the match through the probability frame, the final score and Spain's two goal markers (22 and 58 minutes). The three scenarios at 38–32–30 show this was seen beforehand as a balanced contest, with no side dominant on paper.
And yet the result was a two-goal margin. The gap on the pitch (2 goals) was far wider than the gap in the forecast (8 percentage points). That hints that across the 90 minutes one side was a good deal better than those balanced opening numbers modeled. The timings back that reading: Spain were ahead from the 22nd minute and scored again on 58, so they led for close to 70 minutes without France ever finding a reply. That clean sheet is the clearest fact to lean on when talking about the run of play.
What the probabilities mean: 38% is not a promise
This match is a textbook example of something I always stress: France's 38% was the highest figure of the three scenarios, but it was not a promise. 38% is still less than half, which means that even with the model leaning toward France, it still assigned a full 62% to France not winning. Spain carried a 30% probability, roughly one in three, and one in three is something that happens often, not rarely.
When the three scenarios are almost level, the third one becoming reality is entirely normal. On top of that, the Low confidence label had already signalled that the model wasn't sure, so a result that runs against the predicted scoreline doesn't contradict the forecast at all. Probability describes likelihood; it doesn't guarantee an outcome. Read in that spirit, this 0–2 doesn't break the model, it's simply one of those times the less-favoured scenario comes true.
Sources and notes
All the forecast figures in this piece, the three probabilities of 38–32–30, the 2–1 predicted scoreline, the 2.56 expected total, the 47% chance of 3 or more goals and the Low confidence label, come from the Jarvis supercomputer model, recorded before kick-off. The actual score of France 0–2 Spain is the post-match fact used for comparison. This is statistical analysis, not betting advice.
Frequently asked questions
Who did Jarvis predict would win France vs Spain?
Jarvis doesn't call a winner; it only lays out three scenarios: France 38%, draw 32%, Spain 30%. France were rated slightly highest, but the margin was very thin, and it came with a Low confidence label.
What was the actual result?
France lost 0–2 to Spain. The side the model ranked lowest of the three scenarios was the one that took a comfortable win.
Is the 2–1 predicted scoreline the predicted score?
No. The 2–1 is only the predicted scoreline the model leans toward to describe the expected balance of play, not the most likely score. In reality the match finished 0–2.
Who scored for Spain?
Mikel Oyarzabal opened the scoring from the penalty spot on 22 minutes and Pedro Porro added the second on 58. Both goals belonged to Spain in the 2–0 win.
Why say the forecast was off yet the model wasn't wrong?
Because France carried only 38%, less than half, while Spain carried 30%, roughly one in three. A 30% outcome happening is normal, especially when the model had already attached a Low confidence label. On total goals, the 2.56 forecast sat very close to the actual 2.